DipScript Language Reference
DipScript is a Domain-Specific Language for creating automated stock trading strategies. Write trading rules in readable syntax that executes line by line as market conditions change.
No results found
Try adjusting your search terms or browse the navigation menu.
Introduction
DipScript bridges the gap between complex algorithmic trading and accessible strategy creation. Whether you're a seasoned trader or just starting out, DipScript allows you to translate trading concepts directly into executable code without requiring extensive programming knowledge.
What Makes DipScript Different?
Traditional trading platforms require you to manually watch the market and execute trades. Programming-based solutions require advanced coding skills. DipScript gives you the best of both worlds: automation with simplicity.
- Human-Readable Syntax: Write "IF $PROFIT > 1000 THEN SELL $ALL" instead of complex code
- Real-Time Execution: Your strategy runs continuously, checking conditions as the market moves
- Built-In Variables: Automatic tracking of profits, positions, and market data
- Smart Percentages: Natural percentage calculations that work the way you think
- No Manual Monitoring: Set it and let it run—perfect for day trading when speed matters
TICKER NVDA

// Buy if we haven't bought before
IF $LAST_BUY_PRICE = NULL THEN OBTAIN 400 @ $MARKET_PRICE

// Take profit when up $1000
IF $PROFIT > 1000 THEN SELL $ALL @ $MARKET_PRICE
This script buys 400 shares of NVIDIA at the current market price (if you haven't bought yet), then automatically sells everything when your profit reaches $1,000. No watching required.
How It Works — DipSkip, You & Tradier
DipSkip is not a broker. It is an automation layer that sits between you and your Tradier account. Tradier is a regulated, API-first broker. Your money, positions, and orders all live at Tradier — a regulated, API-first brokerage. DipSkip connects to Tradier's platform via their official API to automatically execute the buy and sell orders specified in your scripts.
To use DipSkip, you need a Tradier account. Sign up at tradier.com to get started, then connect your account to DipSkip via OAuth in the Tradier Connection settings.
The Three Layers
| Layer | Role | What It Does |
|---|---|---|
| You | Strategy Author | Write DipScript strategies, define trading rules, set risk parameters, and monitor performance. |
| DipSkip | Automation Layer | Continuously evaluates your scripts against live market data, and sends trade instructions (buy/sell orders) to your broker via their API. |
| Tradier | Broker | Holds your funds, executes orders on the stock market, provides real-time market data, and handles regulatory compliance. |
What DipSkip Does
- Runs your DipScript strategies continuously during market hours
- Monitors live market data (prices, positions, account balances) via Tradier's API
- Evaluates your trading conditions line by line
- Sends order instructions (OBTAIN/SELL) to Tradier when conditions are met
- Tracks performance, logs trades, and sends you alerts
What Tradier Does
- Holds your account and funds
- Receives order instructions from DipSkip through their API
- Executes the actual buy and sell orders on the stock market
- Provides real-time and historical market data
- Handles all regulatory and compliance requirements
Your Credentials Stay with Tradier
DipSkip connects to your Tradier account using OAuth — the same secure authorization method used by major platforms. You log in directly on Tradier's website and grant DipSkip permission to place trades. Your Tradier username and password are never shared with DipSkip.
DipSkip Never Holds Your Money
All funds remain in your Tradier account at all times. DipSkip only sends trade instructions — it cannot withdraw, transfer, or move your money. You can revoke DipSkip's access from your Tradier account at any time.
Why DipScript for Day Trading?
Day trading requires split-second decisions and constant market monitoring. Missing a price movement by seconds can mean the difference between profit and loss. DipScript solves this by executing your trading rules automatically, faster than any human can.
The Day Trading Challenge
Imagine you're day trading Tesla. You want to buy when the price dips 2% below your last sell, and sell when you're up $500. Doing this manually means:
- Constantly watching the price ticker
- Calculating percentages in your head
- Remembering your last sell price
- Placing orders manually (and hoping you're fast enough)
- Tracking your profit across multiple trades
With DipScript, this becomes two simple lines:
IF $MARKET_PRICE <= $LAST_SELL_PRICE - 2% THEN OBTAIN 100 @ $MARKET_PRICE
IF $PROFIT > 500 THEN SELL $ALL @ $MARKET_PRICE
Perfect for Multiple Trading Styles
- Scalping: Quick in-and-out trades capturing small price movements
- Momentum Trading: Riding price trends with trailing stops
- Breakout Trading: Automatic entry when price breaks resistance levels
- Mean Reversion: Buying dips and selling rallies systematically
For Non-Programmers
You don't need to be a programmer to use DipScript. If you understand trading concepts like "buy low, sell high" and "stop loss," you can learn DipScript. The syntax is simple and readable: "IF $PROFIT > 500 THEN SELL $ALL @ $MARKET_PRICE."
Quick Start
Every DipScript follows the same basic structure:
- Ticker Declaration:
TICKER [SYMBOL](required first line) - Trading Rules: IF statements and commands that define your strategy
- Execution: Scripts run continuously, checking conditions as market data updates
Syntax Rules
- All syntax keywords are UPPERCASE (IF, THEN, OBTAIN, SELL, etc.)
- Variables start with
$and contain no spaces - Each IF statement performs only one action
- Comments start with
// - Commands follow:
<ACTION> <AMOUNT> @ <PRICE>
Your First Strategy in 5 Minutes
Let's build a simple profit-taking strategy step by step:
// Step 1: Declare what stock you're trading
TICKER AAPL

// Step 2: Buy 100 shares if you don't have any yet
IF $ALL = 0 THEN OBTAIN 100 @ $MARKET_PRICE

// Step 3: Sell when profit hits $200
IF $PROFIT > 200 THEN SELL $ALL @ $MARKET_PRICE

// Step 4: Cut losses if down $100
IF $PROFIT < -100 THEN SELL $ALL @ $MARKET_PRICE
That's it! This strategy automatically buys 100 shares of Apple, takes profit at $200 gain, and cuts losses at $100 down. The script runs continuously and executes these rules for you.
Language Structure
DipScript uses a simple, readable syntax where each line represents a complete instruction. Here's a visual guide to how the language and engine work together.
How the Engine Works
Your script runs in a continuous loop. The engine reads your strategy top-to-bottom, evaluates conditions against live market data, and executes actions when conditions are met.
Script Anatomy
Every strategy is a sequence of lines. Each token is color-coded by its role:
Line Types
Every line in a DipScript strategy is one of these six types:
TICKER
Declare which stock to trade. Must be the first line of your script.
SET
Define custom variables and reusable macro conditions for your strategy.
IF / THEN
Conditional logic. When the condition is true, the action executes. Boolean variables can be used directly: IF $IS_UPTREND_5 THEN ...
OBTAIN
Buy shares (or USD amount with USD keyword). Only buys what's needed to reach the target.
SELL
Sell a specific quantity or $ALL shares at market price or a limit price.
EXIT
Immediately halt script execution. Use for emergency exits or end conditions.
Building Conditions
Conditions compare a variable to a value using an operator. Chain multiple conditions with AND / OR.
Available Operators
=
Equal to
!=
Not equal to
>
Greater than
<
Less than
>=
Greater or equal
<=
Less or equal
AND
Both must be true
OR
Either can be true
How Scripts Execute
DipScript processes your strategy line by line from top to bottom. When the market price updates, the engine checks each IF condition. When a condition becomes true, the associated command executes immediately. This happens continuously in real-time as market data streams in.
Important: Only one action can execute per line. If multiple conditions are true at the same time, they'll all execute (in order from top to bottom).
Variables
DipScript automatically tracks everything you need to know about your trades. You never have to manually calculate profits, remember prices, or track positions. Just reference the built-in variables.
All Available Variables
| Variable | Type | Description |
|---|---|---|
| $PROFIT | number | Current profit/loss for active position |
| $PROFIT_PERCENT | number | Unrealized profit/loss as a percentage of cost basis |
| $TOTAL_PROFIT | number | Total profit/loss since script started |
| $PEAK_PROFIT | number | Highest profit reached since last sell |
| $PEAK_TOTAL_PROFIT | number | Highest total profit ever achieved |
| $ALL | number | Current quantity of shares owned |
| $HALF | number | Half of shares owned (half of $ALL) |
| $AMOUNT_OWNED | number | Same as $ALL |
| $MAX | number | Maximum shares affordable (for SELL commands, automatically becomes $ALL) |
| $MARKET_PRICE | number | Current real-time market price |
| $TICKER | string | Current stock symbol |
| $PEAK_PRICE | number | Highest market price since last trade |
| $LOWEST_PRICE | number | Lowest market price since last sell |
| $LAST_BUY_PRICE | number | Price per share of most recent purchase |
| $LAST_SELL_PRICE | number | Price per share of most recent sale |
| $LAST_BUY_AMOUNT | number | Quantity of shares in most recent purchase |
| $LAST_SELL_AMOUNT | number | Quantity of shares in most recent sale |
| $AMOUNT_INVESTED_SINCE_LAST_TRADE | number | Total dollars invested in current position |
| $TOTAL_AMOUNT_INVESTED | number | Total dollars invested across all trades |
| $BUY_TRADE_COUNT | number | Total number of buy transactions executed |
| $SELL_TRADE_COUNT | number | Total number of sell transactions executed |
| $ACCOUNT_EQUITY | number | Account equity (cash + stock value) |
| $BUYING_POWER | number | Available buying power in the account |
| Time & Schedule | ||
| $TIME | string | Current time in HH:MM format (Eastern Time) |
| $MINUTES_SINCE_OPEN | number | Minutes elapsed since market open (9:30 AM ET) |
| $MINUTES_UNTIL_CLOSE | number | Minutes remaining until market close (4:00 PM ET) |
| $DAY_OF_WEEK | number | Day of week: 1=Monday, 2=Tuesday, ..., 5=Friday |
| $DAY_OF_MONTH | number | Calendar day of the month (1-31) |
| $IS_MARKET_OPEN | number | 1 if market is in regular trading hours, 0 otherwise |
| Daily Price Context | ||
| $DAY_OPEN | number | Today's opening price for the stock |
| $DAY_HIGH | number | Today's intraday high price |
| $DAY_LOW | number | Today's intraday low price |
| $PREV_CLOSE | number | Yesterday's closing price |
| $GAP_PERCENT | number | Gap percentage from previous close to today's open |
| $DAILY_CHANGE_PERCENT | number | Stock's percentage change on the current trading day |
| Broad Market | ||
| $SPY_CHANGE_PERCENT | number | S&P 500 (SPY) daily percentage change |
| $QQQ_CHANGE_PERCENT | number | Nasdaq 100 (QQQ) daily percentage change |
| $VIX | number | CBOE Volatility Index level (fear gauge) |
| Volume | ||
| $VOLUME | number | Current day's trading volume |
| $RELATIVE_VOLUME | number | Today's volume / average volume (>1 = above average activity) |
| Trend Detection | ||
| $IS_UPTREND_3 | boolean | True if prices over the last 3 minutes trend upward. Use directly: IF $IS_UPTREND_3 THEN ... |
| $IS_DOWNTREND_3 | boolean | True if prices over the last 3 minutes trend downward. Use directly: IF $IS_DOWNTREND_3 THEN ... |
| $IS_UPTREND_5 | boolean | True if prices over the last 5 minutes trend upward. Use directly: IF $IS_UPTREND_5 THEN ... |
| $IS_DOWNTREND_5 | boolean | True if prices over the last 5 minutes trend downward. Use directly: IF $IS_DOWNTREND_5 THEN ... |
| $IS_UPTREND_10 | boolean | True if prices over the last 10 minutes trend upward |
| $IS_DOWNTREND_10 | boolean | True if prices over the last 10 minutes trend downward |
| $IS_UPTREND_20 | boolean | True if prices over the last 20 minutes trend upward |
| $IS_DOWNTREND_20 | boolean | True if prices over the last 20 minutes trend downward |
| $IS_UPTREND_1H | boolean | True if prices over the last 1 hour trend upward |
| $IS_DOWNTREND_1H | boolean | True if prices over the last 1 hour trend downward |
| Moving Averages | ||
| $SMA_5 | number | Simple moving average over the last 5 minutes |
| $SMA_10 | number | Simple moving average over the last 10 minutes |
| $SMA_20 | number | Simple moving average over the last 20 minutes |
| $SMA_50 | number | Simple moving average over the last 50 minutes |
| $SMA_100 | number | Simple moving average over the last 100 minutes |
| $SMA_200 | number | Simple moving average over the last 200 minutes |
| $SMA_1H | number | Simple moving average over the last 1 hour |
| $SMA_2H | number | Simple moving average over the last 2 hours |
| $SMA_4H | number | Simple moving average over the last 4 hours |
| Rolling High/Low | ||
| $HIGH_5 | number | Highest price in the last 5 minutes |
| $LOW_5 | number | Lowest price in the last 5 minutes |
| $HIGH_20 | number | Highest price in the last 20 minutes |
| $LOW_20 | number | Lowest price in the last 20 minutes |
| $HIGH_50 | number | Highest price in the last 50 minutes |
| $LOW_50 | number | Lowest price in the last 50 minutes |
| $HIGH_100 | number | Highest price in the last 100 minutes |
| $LOW_100 | number | Lowest price in the last 100 minutes |
| $HIGH_200 | number | Highest price in the last 200 minutes |
| $LOW_200 | number | Lowest price in the last 200 minutes |
| $HIGH_1H | number | Highest price in the last 1 hour |
| $LOW_1H | number | Lowest price in the last 1 hour |
| $HIGH_2H | number | Highest price in the last 2 hours |
| $LOW_2H | number | Lowest price in the last 2 hours |
| $HIGH_4H | number | Highest price in the last 4 hours |
| $LOW_4H | number | Lowest price in the last 4 hours |
| Price Momentum | ||
| $CHANGE_PERCENT_5 | number | Percentage change from 5 minutes ago to current price |
| $CHANGE_PERCENT_10 | number | Percentage change from 10 minutes ago to current price |
| $CHANGE_PERCENT_20 | number | Percentage change from 20 minutes ago to current price |
| $CHANGE_PERCENT_50 | number | Percentage change from 50 minutes ago to current price |
| $CHANGE_PERCENT_100 | number | Percentage change from 100 minutes ago to current price |
| $CHANGE_PERCENT_200 | number | Percentage change from 200 minutes ago to current price |
| $CHANGE_PERCENT_1H | number | Percentage change from 1 hour ago to current price |
| $CHANGE_PERCENT_2H | number | Percentage change from 2 hours ago to current price |
| $CHANGE_PERCENT_4H | number | Percentage change from 4 hours ago to current price |
| Volatility | ||
| $VOLATILITY_10 | number | Standard deviation of prices over the last 10 minutes |
| $VOLATILITY_20 | number | Standard deviation of prices over the last 20 minutes |
| $VOLATILITY_50 | number | Standard deviation of prices over the last 50 minutes |
| $VOLATILITY_1H | number | Standard deviation of prices over the last 1 hour |
| Normalized Trend Strength | ||
| $TREND_SLOPE_5 | number | Normalized slope over the last 5 minutes (positive = uptrend, negative = downtrend) |
| $TREND_SLOPE_10 | number | Normalized slope over the last 10 minutes (positive = uptrend, negative = downtrend) |
| $TREND_SLOPE_20 | number | Normalized slope over the last 20 minutes (positive = uptrend, negative = downtrend) |
| $TREND_R2_5 | number | R-squared (0-1) over the last 5 minutes; how strongly the price follows a linear trend |
| $TREND_R2_10 | number | R-squared (0-1) over the last 10 minutes; how strongly the price follows a linear trend |
| $TREND_R2_20 | number | R-squared (0-1) over the last 20 minutes; how strongly the price follows a linear trend |
| $TREND_SLOPE_1H | number | Normalized slope over the last 1 hour (positive = uptrend, negative = downtrend) |
| $TREND_R2_1H | number | R-squared (0-1) over the last 1 hour; how strongly the price follows a linear trend |
| Daily Trend Analysis | ||
| $DAILY_SMA_5 | number | Simple moving average of the last 5 daily closing prices |
| $DAILY_SMA_10 | number | Simple moving average of the last 10 daily closing prices |
| $DAILY_SMA_20 | number | Simple moving average of the last 20 daily closing prices |
| $DAILY_SMA_50 | number | Simple moving average of the last 50 daily closing prices |
| $DAILY_SMA_100 | number | Simple moving average of the last 100 daily closing prices |
| $DAILY_SMA_200 | number | Simple moving average of the last 200 daily closing prices |
| $DAILY_TREND_SLOPE_5 | number | Normalized slope of the last 5 daily closing prices |
| $DAILY_TREND_SLOPE_10 | number | Normalized slope of the last 10 daily closing prices |
| $DAILY_TREND_SLOPE_20 | number | Normalized slope of the last 20 daily closing prices |
| $DAILY_TREND_SLOPE_50 | number | Normalized slope of the last 50 daily closing prices |
| $DAILY_TREND_SLOPE_100 | number | Normalized slope of the last 100 daily closing prices |
| $DAILY_TREND_SLOPE_200 | number | Normalized slope of the last 200 daily closing prices |
| $DAILY_TREND_R2_5 | number | R-squared (0-1) of the last 5 daily closing prices |
| $DAILY_TREND_R2_20 | number | R-squared (0-1) of the last 20 daily closing prices |
| $DAILY_TREND_R2_50 | number | R-squared (0-1) of the last 50 daily closing prices |
| $DAILY_TREND_R2_200 | number | R-squared (0-1) of the last 200 daily closing prices |
| Streak | ||
| $UP_STREAK | number | Consecutive price increases from the most recent price |
| $DOWN_STREAK | number | Consecutive price decreases from the most recent price |
| $VWAP | price | Time-weighted average price for the current trading day. Resets at market open |
| $ATR_14 | number | Average True Range over the last 14 minutes (avg price movement between cycles) |
| $RSI_14 | number | Relative Strength Index (0-100) over the last 14 minutes. Above 70 = overbought, below 30 = oversold |
| $MACD_SIGNAL | number | 9-minute EMA of the MACD line. MACD crossing above signal = bullish, below = bearish |
| $MACD_HISTOGRAM | number | MACD minus MACD_SIGNAL. Positive = bullish, negative = bearish. Shrinking toward zero signals upcoming crossover |
| $STOCHASTIC_K | number | Stochastic Oscillator %K (14-minute, 0-100). Above 80 = overbought, below 20 = oversold |
| $STOCHASTIC_D | number | Stochastic %D (3-minute SMA of %K). %K crossing above %D = buy signal, below = sell signal |
| $ADX | number | Average Directional Index (14-minute, 0-100). Above 25 = strong trend, below 20 = weak/ranging |
| $PROFIT_PERCENT | number | Unrealized profit/loss as a percentage of cost basis. Positive = up, negative = down, 0 = no position |
| $MINUTES_SINCE_LAST_TRADE | number | Minutes elapsed since last buy or sell execution. Returns 9999 if no trades made |
| $CONSECUTIVE_LOSSES | number | Number of consecutive losing trades. Resets to 0 on a winning trade |
Profit & Performance Variables
These variables track your money—how much you're making or losing:
$PROFIT
Current profit/loss in dollars for your active position. Positive = making money, negative = losing money.
$PROFIT_PERCENT
Your unrealized profit/loss as a percentage of your cost basis. If you bought at $100 and the price is now $105, this returns 5.0 (a 5% gain). If the price dropped to $95, this returns -5.0 (a 5% loss). Returns 0 when you have no position. Use this for percentage-based take-profit and stop-loss strategies that work regardless of position size.
// Take profit at 5% gain
IF $PROFIT_PERCENT > 5 THEN SELL $ALL @ $MARKET_PRICE

// Stop loss at 3% decline
IF $PROFIT_PERCENT < -3 THEN SELL $ALL @ $MARKET_PRICE
$TOTAL_PROFIT
Total profit/loss in dollars since your script started. Includes all closed trades.
$PEAK_PROFIT
Highest profit in dollars you've reached since your last sell. Useful for trailing stops.
$PEAK_TOTAL_PROFIT
Highest total profit ever achieved across all trades. Your all-time high.
- You buy 100 shares of NVDA at $100 each ($10,000 invested)
- Price rises to $105:
$PROFIT = $500,$PEAK_PROFIT = $500 - Price rises to $110:
$PROFIT = $1000,$PEAK_PROFIT = $1000 - Price drops to $108:
$PROFIT = $800,$PEAK_PROFIT = $1000(unchanged) - You sell at $108:
$TOTAL_PROFIT = $800, position closes - You buy again and make $300:
$TOTAL_PROFIT = $1100
Calculating Profit Percentages
DipScript focuses on dollar values to avoid mathematical ambiguity. If you need percentage-based logic, calculate it using dollar variables:
// To check if profit is greater than 20%:
IF $PROFIT > $AMOUNT_INVESTED_SINCE_LAST_TRADE * 20% THEN SELL $ALL @ $MARKET_PRICE

// To check if total profit is greater than 15% of total invested:
IF $TOTAL_PROFIT > $TOTAL_AMOUNT_INVESTED * 15% THEN SELL $ALL @ $MARKET_PRICE
Position & Trading Variables
These variables tell you what you own and your trading history:
$ALL / $AMOUNT_OWNED
How many shares you currently own. $AMOUNT_OWNED is an alias for $ALL. Use this to sell everything: SELL $ALL @ $MARKET_PRICE
$HALF
Half of the shares you currently own (half of $ALL). Useful for partial position exits: SELL $HALF @ $MARKET_PRICE
$MAX
Maximum shares you can afford at current price with available cash. Includes a 1% buffer for market order slippage to ensure your order doesn't fail due to price movement. Perfect for buying with all available funds: OBTAIN $MAX @ $MARKET_PRICE. Note: When used with SELL commands, $MAX is automatically converted to $ALL (your current position size), since "maximum affordable" doesn't apply to selling.
$LAST_BUY_PRICE
Price per share of your most recent purchase. Useful for calculating breakeven points.
$LAST_SELL_PRICE
Price per share of your most recent sale.
$LAST_BUY_AMOUNT
Number of shares in your most recent purchase.
$LAST_SELL_AMOUNT
Number of shares in your most recent sale.
Market & Investment Variables
Live market data and investment tracking:
$MARKET_PRICE
Current real-time market price of the stock. This is constantly updated and reflects live market data.
$TICKER
Current stock symbol (e.g., "AAPL", "TSLA"). Useful when running the same script on multiple stocks.
$PEAK_PRICE
Highest market price reached since your last trade. Great for trailing stops: IF $MARKET_PRICE < $PEAK_PRICE - 5 THEN SELL $ALL
$LOWEST_PRICE
Lowest market price since your last sell. Useful for dip buying strategies.
$AMOUNT_INVESTED_SINCE_LAST_TRADE
Total dollars you've invested in your current position. Resets when you fully exit a position.
$TOTAL_AMOUNT_INVESTED
Total dollars invested across all trades since script started. Cumulative value that never resets.
Trade Counting Variables
Track how many trades you've made:
$BUY_TRADE_COUNT
Total number of buy transactions executed. Useful for limiting entries: IF $BUY_TRADE_COUNT < 3 THEN OBTAIN 100
$SELL_TRADE_COUNT
Total number of sell transactions executed. Track your trading frequency and execution count.
Account Variables
These variables let you size positions and gate trades against your available capital.
$ACCOUNT_EQUITY
Your total account equity (cash + stock value). Use this for position sizing relative to your account:
IF $ACCOUNT_EQUITY >= 25000 THEN OBTAIN 100 @ $MARKET_PRICE
$BUYING_POWER
Your available buying power in the account. This is the amount you can use to purchase securities.
For margin accounts, this may be higher than your cash balance. Use this to ensure you have sufficient
funds before placing orders: IF $BUYING_POWER > 1000 THEN OBTAIN 10 @ $MARKET_PRICE
Time & Schedule Variables
These variables let you build time-aware strategies that react to market hours, days of the week, and intraday timing.
$TIME
Current time in HH:MM format, Eastern Time. Use this to restrict trades to specific times of day: IF $TIME > 10:00 AND $ALL = 0 THEN OBTAIN 100 @ $MARKET_PRICE
$MINUTES_SINCE_OPEN
Minutes elapsed since the market opened at 9:30 AM ET. At 10:00 AM this would be 30, at noon it would be 150.
Useful for avoiding the volatile first few minutes:
IF $MINUTES_SINCE_OPEN > 30 AND $ALL = 0 THEN OBTAIN $MAX @ $MARKET_PRICE
$MINUTES_UNTIL_CLOSE
Minutes remaining until market close at 4:00 PM ET. Use this to exit positions before end of day:
IF $MINUTES_UNTIL_CLOSE < 15 AND $ALL != 0 THEN SELL $ALL @ $MARKET_PRICE
$DAY_OF_WEEK
Numeric day of the week: 1=Monday, 2=Tuesday, 3=Wednesday, 4=Thursday, 5=Friday. Useful for day-specific strategies: IF $DAY_OF_WEEK = 5 AND $ALL != 0 THEN SELL $ALL @ $MARKET_PRICE
$DAY_OF_MONTH
Calendar day of the month (1-31). Can be used for monthly timing patterns.
$IS_MARKET_OPEN
Returns 1 if the market is in regular trading hours (9:30 AM - 4:00 PM ET, weekdays), 0 otherwise.
// Avoid the volatile opening 30 minutes
IF $MINUTES_SINCE_OPEN > 30 AND $ALL = 0 THEN OBTAIN $MAX @ $MARKET_PRICE

// Close all positions 15 minutes before market close
IF $MINUTES_UNTIL_CLOSE < 15 AND $ALL != 0 THEN SELL $ALL @ $MARKET_PRICE
Daily Price Context Variables
These variables provide today's price action data, giving you context about how the stock is moving relative to yesterday and throughout the current day.
$DAY_OPEN
Today's opening price for the stock. The opening price is the first traded price when the market opens at 9:30 AM ET.
$DAY_HIGH
The highest price the stock has reached during the current trading day. Updates in real-time as new highs are made.
$DAY_LOW
The lowest price the stock has reached during the current trading day. Updates in real-time as new lows are made.
$PREV_CLOSE
Yesterday's closing price. This is the last traded price from the previous trading session.
$GAP_PERCENT
The gap percentage measures how much a stock jumped (or dropped) from yesterday's close to today's open.
A positive value means the stock "gapped up" (opened higher than yesterday's close), and negative means it "gapped down."
Calculated as: ((today's open - yesterday's close) / yesterday's close) × 100.
For example, if a stock closed at $100 yesterday and opens at $103 today, $GAP_PERCENT = 3.0.
$DAILY_CHANGE_PERCENT
The stock's percentage change for the current trading day, measured from yesterday's close to the current price.
// Buy if the stock gapped down more than 2%
IF $GAP_PERCENT < -2 AND $ALL = 0 THEN OBTAIN $MAX @ $MARKET_PRICE

// Sell if the stock recovers back above yesterday's close
IF $MARKET_PRICE > $PREV_CLOSE AND $ALL != 0 THEN SELL $ALL @ $MARKET_PRICE
Using Daily Range for Support & Resistance
The day's high ($DAY_HIGH) and low ($DAY_LOW) act as natural support and resistance levels.
If the price breaks above the day's high, it could signal upward momentum. If it breaks below the day's low, it could
signal weakness. Use $PREV_CLOSE as another key reference level.
Broad Market Variables
These variables track the overall market direction, letting you trade with or against the trend. Trading with the broader market on your side generally improves outcomes.
$SPY_CHANGE_PERCENT
The daily percentage change of the S&P 500 ETF (SPY). SPY tracks the 500 largest U.S. companies and is the most widely used gauge of the overall stock market. A positive value means the market is up, negative means it's down.
$QQQ_CHANGE_PERCENT
The daily percentage change of the Nasdaq 100 ETF (QQQ). QQQ is heavily weighted toward technology stocks (Apple, Microsoft, NVIDIA, etc.) and tends to be more volatile than SPY. Use this if you're trading tech-heavy stocks.
$VIX
The CBOE Volatility Index (VIX), often called the "fear gauge." It measures expected market volatility over the next 30 days based on S&P 500 options prices. Key levels:
- Below 15: Low volatility, market is calm/complacent
- 15-25: Normal range
- Above 25: High volatility, elevated fear
- Above 30: Extreme fear, often coincides with sharp market selloffs
// Only buy when the overall market is green and VIX is calm
IF $SPY_CHANGE_PERCENT > 0 AND $VIX < 25 AND $ALL = 0 THEN OBTAIN $MAX @ $MARKET_PRICE

// Emergency exit: sell everything if VIX spikes above 30
IF $VIX > 30 AND $ALL != 0 THEN SELL $ALL @ $MARKET_PRICE
Volume Variables
Volume tells you how many shares are being traded. High volume confirms price moves, while low volume may signal weak moves that could reverse.
$VOLUME
The total number of shares traded so far on the current day. Volume increases throughout the day and resets at market open.
$RELATIVE_VOLUME
Relative volume (RVOL) compares today's volume to the stock's average volume. Calculated as:
today's volume / average volume. A value of 1.0 means average activity. A value of 2.0 means
twice the normal volume is being traded, which often indicates significant news, earnings, or unusual interest.
- Below 0.5: Very low activity, stock is quiet
- 0.5-1.5: Normal range
- Above 1.5: Above-average activity, worth paying attention
- Above 3.0: Very high activity, often driven by news or events
// Buy when price breaks above day high with strong volume
IF $MARKET_PRICE > $DAY_HIGH AND $RELATIVE_VOLUME > 1.5 AND $ALL = 0 THEN OBTAIN $MAX @ $MARKET_PRICE

// Avoid buying into low-volume moves
IF $RELATIVE_VOLUME < 0.5 AND $ALL != 0 THEN SELL $ALL @ $MARKET_PRICE
Trend Detection Variables
Trend variables use linear regression on recent prices to detect whether a stock is trending up or down. They are boolean variables — use them directly in conditions without needing = 1. Use NOT to negate: IF NOT $IS_DOWNTREND_10 THEN ...
$IS_UPTREND_3 / $IS_DOWNTREND_3
Detects very short-term trends over the last 3 minutes. The most responsive trend indicator — reacts quickly to immediate price movement. Both are false (0) until 3 minutes of price data have been collected.
$IS_UPTREND_5 / $IS_DOWNTREND_5
Detects short-term trends over the last 5 minutes. Useful for quick momentum checks.
If the linear regression slope of prices over the last 5 minutes is positive, $IS_UPTREND_5 is true.
If negative, $IS_DOWNTREND_5 is true. Both are false (0) until 5 minutes of price data have been collected.
$IS_UPTREND_10 / $IS_DOWNTREND_10
Detects medium-term trends over the last 10 minutes. Balances responsiveness with noise filtering. Both are false (0) until 10 minutes of price data have been collected.
$IS_UPTREND_20 / $IS_DOWNTREND_20
Detects longer-term trends over the last 20 minutes. More stable but slower to react. Both are false (0) until 20 minutes of price data have been collected.
$IS_UPTREND_1H / $IS_DOWNTREND_1H
Detects trends over the last 1 hour. Provides a broader view of intraday price direction, smoothing out short-term noise. Both are false (0) until 1 hour of price data has been collected.
// Only buy if uptrending and NOT downtrending
IF $IS_UPTREND_5 AND NOT $IS_DOWNTREND_5 AND $ALL = 0 THEN OBTAIN $MAX @ $MARKET_PRICE

// Sell when uptrend ends
IF NOT $IS_UPTREND_10 AND $ALL != 0 THEN SELL $ALL @ $MARKET_PRICE
Moving Average Variables
Moving averages smooth out price noise by averaging prices over the last N minutes. They're the most widely used technical indicator for identifying support, resistance, and trend direction.
$SMA_5 / $SMA_10 / $SMA_20 / $SMA_50 / $SMA_100 / $SMA_200
The simple moving average (SMA) of prices over the last 5, 10, 20, 50, 100, or 200 minutes. When the current price is above the SMA, it suggests an uptrend. When below, a downtrend. Comparing short and long SMAs can signal trend changes. The longer-timeframe SMAs (50, 100, 200) provide stronger support/resistance levels and are widely used by institutional traders for identifying major trend shifts.
$SMA_1H / $SMA_2H / $SMA_4H
Simple moving averages over 1 hour, 2 hours, and 4 hours respectively.
These hour-based SMAs provide convenient intraday timeframes that are easy to reason about.
$SMA_1H captures the short-term intraday trend, while $SMA_4H covers
most of the trading day and gives a broader view of the day's price action.
// Buy when price is above the long-term average
IF $MARKET_PRICE > $SMA_20 AND $ALL = 0 THEN OBTAIN $MAX @ $MARKET_PRICE

// Sell when price drops below the short-term average
IF $MARKET_PRICE < $SMA_5 AND $ALL != 0 THEN SELL $ALL @ $MARKET_PRICE
Rolling High/Low Variables
These track the highest and lowest prices over recent minutes, useful for breakout and breakdown detection.
$HIGH_5 / $LOW_5
Highest and lowest price in the last 5 minutes. Useful for short-term breakout detection.
$HIGH_20 / $LOW_20
Highest and lowest price in the last 20 minutes. Useful for longer-term breakout and support/resistance levels.
$HIGH_50 / $LOW_50
Highest and lowest price in the last 50 minutes. Provides medium-term range boundaries for swing trading strategies.
$HIGH_100 / $LOW_100
Highest and lowest price in the last 100 minutes. Useful for identifying significant support and resistance zones.
$HIGH_200 / $LOW_200
Highest and lowest price in the last 200 minutes. Represents long-term price extremes for major breakout/breakdown detection.
$HIGH_1H / $LOW_1H
Highest and lowest price in the last 1 hour. A natural intraday timeframe for breakout and support/resistance detection.
$HIGH_2H / $LOW_2H
Highest and lowest price in the last 2 hours. Useful for mid-session range analysis.
$HIGH_4H / $LOW_4H
Highest and lowest price in the last 4 hours. Covers most of the trading session for broad intraday range tracking.
// Buy breakout above 20-minute high
IF $MARKET_PRICE > $HIGH_20 AND $ALL = 0 THEN OBTAIN $MAX @ $MARKET_PRICE

// Sell breakdown below 5-minute low
IF $MARKET_PRICE < $LOW_5 AND $ALL != 0 THEN SELL $ALL @ $MARKET_PRICE
Price Momentum Variables
Momentum variables measure the percentage change from N minutes ago to the current price. Positive values mean the price has risen, negative means it has fallen.
$CHANGE_PERCENT_5 / $CHANGE_PERCENT_10 / $CHANGE_PERCENT_20 / $CHANGE_PERCENT_50 / $CHANGE_PERCENT_100 / $CHANGE_PERCENT_200
Percentage change from 5, 10, 20, 50, 100, or 200 minutes ago to the current price.
For example, if the price was $100 five minutes ago and is now $105, $CHANGE_PERCENT_5 = 5.00.
The longer-timeframe variants (50, 100, 200) capture broader momentum trends useful for position trading.
$CHANGE_PERCENT_1H / $CHANGE_PERCENT_2H / $CHANGE_PERCENT_4H
Percentage change from 1 hour, 2 hours, or 4 hours ago to the current price. These hour-based variants provide easy-to-interpret momentum over natural intraday timeframes.
Volatility Variables
Volatility measures how much the price is moving. Higher values mean more price swings, lower values mean the stock is trading in a tighter range.
$VOLATILITY_10 / $VOLATILITY_20 / $VOLATILITY_50
Standard deviation of prices over the last 10, 20, or 50 minutes. Use these to avoid trading in choppy markets or to adjust position sizing.
$VOLATILITY_50 provides a longer-term volatility baseline useful for comparing current conditions against recent history.
$VOLATILITY_1H
Standard deviation of prices over the last 1 hour. Provides a broader volatility measure that filters out micro-fluctuations and gives a clearer picture of overall intraday price variability.
Normalized Trend Strength Variables
These variables quantify how strong and consistent a price trend is, using linear regression analysis on recent price data.
$TREND_SLOPE_5 / $TREND_SLOPE_10 / $TREND_SLOPE_20
The normalized slope of a linear regression fitted to prices over the last 5, 10, or 20 minutes.
Positive values indicate an uptrend, negative values indicate a downtrend, and the magnitude indicates trend strength.
Unlike $IS_UPTREND_* (boolean), these give you a continuous measure of trend intensity.
$TREND_SLOPE_1H
Normalized slope over the last 1 hour. Provides a broader trend strength measure that captures the overall intraday direction without reacting to every small price move.
$TREND_R2_5 / $TREND_R2_10 / $TREND_R2_20
The R-squared (coefficient of determination) of the trend line, ranging from 0 to 1. Values near 1 mean prices are moving in a clean, linear trend. Values near 0 mean prices are choppy with no clear direction. Use R-squared to filter out noisy trends — a high slope with low R-squared is unreliable, while a high slope with high R-squared is a strong, consistent trend.
$TREND_R2_1H
R-squared over the last 1 hour. When combined with $TREND_SLOPE_1H,
helps identify strong, consistent intraday trends versus choppy price action.
Daily Trend Analysis Variables
These variables are computed from actual daily closing prices fetched from the Tradier historical data API. Unlike minute-based intraday variables (which use intraday price snapshots), daily variables use real trading-day close prices, making them ideal for longer-term trend analysis and position trading strategies.
Note: Daily trend analysis variables are not available in backtesting. They require live historical data from the Tradier API.
$DAILY_SMA_5 / $DAILY_SMA_10 / $DAILY_SMA_20 / $DAILY_SMA_50 / $DAILY_SMA_100 / $DAILY_SMA_200
Simple moving average of the last 5, 10, 20, 50, 100, or 200 daily closing prices.
The classic $DAILY_SMA_200 is the most widely followed indicator on Wall Street — price above the 200-day SMA is broadly considered bullish, and below it bearish.
$DAILY_SMA_50 crossing above $DAILY_SMA_200 is the famous "golden cross" signal.
$DAILY_TREND_SLOPE_5 / $DAILY_TREND_SLOPE_10 / $DAILY_TREND_SLOPE_20 / $DAILY_TREND_SLOPE_50 / $DAILY_TREND_SLOPE_100 / $DAILY_TREND_SLOPE_200
Normalized slope of a linear regression fitted to the last N daily closing prices. Positive values indicate an uptrend over that period, negative values a downtrend. The magnitude reflects how steep the trend is.
$DAILY_TREND_R2_5 / $DAILY_TREND_R2_20 / $DAILY_TREND_R2_50 / $DAILY_TREND_R2_200
R-squared (0-1) of the daily trend line. High values mean the daily prices are trending consistently; low values mean choppy or sideways action.
Combine with $DAILY_TREND_SLOPE_* to find strong, reliable trends.
Streak Variables
Streak variables count how many consecutive price moves have occurred in one direction, starting from the most recent price.
$UP_STREAK / $DOWN_STREAK
$UP_STREAK counts consecutive price increases. $DOWN_STREAK counts consecutive decreases.
For example, if the last 4 prices were 100, 99, 98, 97 then $DOWN_STREAK = 3 and $UP_STREAK = 0.
// Buy the dip after 3 consecutive drops
IF $DOWN_STREAK > 3 AND $ALL = 0 THEN OBTAIN $MAX @ $MARKET_PRICE
Advanced Indicator Variables
These indicators provide deeper market analysis to help you make smarter entry and exit decisions.
$VWAP
Time-weighted average price for the current trading day. Resets at market open each day. This is a key institutional reference level — price above VWAP suggests buyers are in control, price below VWAP suggests sellers are in control. Use it as a trend filter to only trade in the direction of the day's momentum.
// Only enter long positions when price is above VWAP
IF $ALL = 0 AND $MARKET_PRICE > $VWAP AND $IS_UPTREND_10 THEN OBTAIN $MAX @ $MARKET_PRICE
$ATR_14
Average True Range over the last 14 minutes. Measures the average price movement (in dollars) between script evaluation cycles. Instead of using a fixed dollar stop-loss, use ATR to set stops that automatically adapt to how volatile the stock is right now. On calm days, your stop will be tighter; on wild days, it gives more room. Returns 0 when insufficient price history has accumulated (fewer than 15 minutes of data).
// Dynamic stop: exit if loss exceeds 3x the average price movement
IF $PROFIT < 0 - $ATR_14 * 3 THEN SELL $ALL @ $MARKET_PRICE
$ATR_1H
Average True Range over the last 1 hour. Provides a broader volatility measure useful for setting
wider stops on longer-duration trades. Smoother than $ATR_14 because it averages over more data.
$RSI_14
Relative Strength Index calculated over the last 14 minutes. Ranges from 0 to 100. Values above 70 indicate the stock may be overbought (price went up too fast, may pull back). Values below 30 indicate the stock may be oversold (price dropped too fast, may bounce). Returns 50 (neutral) when insufficient price history has accumulated.
// Don't buy if RSI indicates overbought
IF $ALL = 0 AND $RSI_14 < 70 AND $IS_UPTREND_10 THEN OBTAIN $MAX @ $MARKET_PRICE

// Buy oversold bounces
IF $ALL = 0 AND $RSI_14 < 30 AND $IS_UPTREND_3 THEN OBTAIN $MAX @ $MARKET_PRICE
$EMA_1H
Exponential moving average over the last 1 hour. Like the minute-based EMAs but covering a broader intraday timeframe. Useful as a trend filter or dynamic support/resistance level.
$RSI_1H
Relative Strength Index calculated over the last 1 hour. Provides a smoother, less noisy RSI reading compared to the 14-minute version. Better for identifying sustained overbought/oversold conditions rather than brief spikes.
$MACD_SIGNAL
The 9-minute EMA of the MACD line, commonly called the "signal line." Traders watch for crossovers between the MACD line and this signal line. When MACD crosses above the signal line, it is a bullish crossover (buy signal). When MACD crosses below, it is a bearish crossover (sell signal).
$MACD_HISTOGRAM
The difference between the MACD line and the MACD signal line (MACD minus MACD_SIGNAL). When positive, MACD is above the signal (bullish momentum). When negative, MACD is below (bearish). The histogram shrinking toward zero signals an upcoming crossover. A flip from negative to positive confirms a bullish MACD crossover just occurred.
// Buy when MACD crosses above signal line
IF $ALL = 0 AND $MACD > $MACD_SIGNAL THEN OBTAIN $MAX @ $MARKET_PRICE

// Sell when MACD crosses below signal line
IF $MACD < $MACD_SIGNAL THEN SELL $ALL @ $MARKET_PRICE
$STOCHASTIC_K
The Stochastic Oscillator %K line (14-minute). Ranges from 0 to 100 and measures where the current price sits relative to the high-low range over the last 14 minutes. Above 80 = overbought, below 20 = oversold. Returns 50 when there is insufficient price history.
$STOCHASTIC_D
The Stochastic %D line — a 3-minute simple moving average of %K, serving as the signal line. When %K crosses above %D in the oversold zone (below 20), it is a buy signal. When %K crosses below %D in the overbought zone (above 80), it is a sell signal.
// Buy when %K crosses above %D in oversold territory
IF $ALL = 0 AND $STOCHASTIC_K > $STOCHASTIC_D AND $STOCHASTIC_K < 20 THEN OBTAIN $MAX @ $MARKET_PRICE
$ADX
The Average Directional Index (14-minute). Measures trend strength on a scale of 0 to 100, regardless of whether the trend is up or down. Above 25 = strong trend (good for trend-following strategies). Below 20 = weak or no trend (ranging market, good for mean-reversion strategies). Use ADX as a filter to determine which type of strategy to apply.
// Only buy trending stocks with confirmed uptrend
IF $ALL = 0 AND $ADX > 25 AND $IS_UPTREND_10 THEN OBTAIN $MAX @ $MARKET_PRICE
Trade Tracking Variables
These variables help you manage trade timing and protect against losing streaks.
$MINUTES_SINCE_LAST_TRADE
Minutes elapsed since your last buy or sell execution. Use this to enforce cooldown periods after trades, preventing the script from immediately re-entering after a stop-loss. Returns 9999 if no trades have been made yet.
// Only re-enter if 30+ minutes have passed since last trade
IF $ALL = 0 AND $MINUTES_SINCE_LAST_TRADE > 30 AND $IS_UPTREND_10 THEN OBTAIN $MAX @ $MARKET_PRICE
$CONSECUTIVE_LOSSES
Tracks how many losing trades have occurred in a row. Increments on each sell where profit is negative, and resets to 0 on any winning trade. Use this as an entry filter to pause trading during losing streaks. A winning trade resets the counter, automatically resuming entries.
Don't use $CONSECUTIVE_LOSSES with EXIT
EXIT permanently halts your script — it won't restart on its own. Instead, add $CONSECUTIVE_LOSSES
as a condition on your entry line. This pauses new trades during losing streaks but keeps the script running
so it can resume after conditions improve.
// Only enter if fewer than 3 consecutive losses
IF $ALL = 0 AND $CONSECUTIVE_LOSSES < 3 AND $IS_UPTREND_10 THEN OBTAIN $MAX @ $MARKET_PRICE
Commands
DipScript provides five core commands for executing trades and managing your strategy: TICKER, OBTAIN, SELL, SET, and EXIT. Think of these as the "verbs" of your trading language.
TICKER (Stock Declaration)
The TICKER command declares which stock your script trades. This must be the first line of every DipScript—it tells the system which stock symbol to monitor and trade. The symbol must be a valid US equity ticker (maximum 10 characters).
// Trade Apple stock
TICKER AAPL

// Trade Tesla stock
TICKER TSLA

// Trade NVIDIA stock
TICKER NVDA
Required First Line
TICKER must always be the first non-comment line in your script. If it's missing or placed
elsewhere, your script will fail validation with error code E-TKR-001.
OBTAIN (Target Position)
The OBTAIN command reaches a target position size, only buying what is needed. If you already own the target amount, nothing is purchased. If you own some shares, OBTAIN buys only the difference to reach the target. Think of it as "ensure I have this many shares."
How OBTAIN Works
OBTAIN 100when you own 0 shares → buys 100 sharesOBTAIN 100when you own 40 shares → buys 60 sharesOBTAIN 100when you own 100+ shares → does nothing
// Ensure you have 100 shares at current market price
OBTAIN 100 @ $MARKET_PRICE

// Reach max affordable position at 2% below market (limit order)
OBTAIN $MAX @ $MARKET_PRICE - 2%

// Target 50 shares at $10 below last sell price
OBTAIN 50 @ $LAST_SELL_PRICE - 10

// Reach $5000 worth at market (buys only what's needed)
OBTAIN USD 5000
SELL (Sell Orders)
The SELL command liquidates your positions. You have precise control over quantity and exit price.
// Sell all shares immediately at market price
SELL $ALL @ $MARKET_PRICE

// Sell 100 shares at 5% above market (limit order)
SELL 100 @ $MARKET_PRICE + 5%

// Sell half your position at 15% profit
SELL $ALL / 2 @ $LAST_BUY_PRICE + 15%

// Sell at exactly $150 per share
SELL $ALL @ 150
Using $MAX with SELL
If you use $MAX in a SELL command, DipSkip automatically converts it to $ALL.
This is because $MAX means "maximum shares you can afford to buy"—which doesn't make
sense when selling. So SELL $MAX @ $MARKET_PRICE will sell your entire position,
exactly like SELL $ALL @ $MARKET_PRICE.
SET (Variable Assignment)
The SET command creates custom variables to make your strategies more readable and maintainable. This is especially useful when you want to adjust parameters without rewriting your entire strategy.
// Set a custom buy amount
SET $BUY_AMOUNT = 600

// Set a USD investment amount for fractional shares
SET $INVESTMENT_USD = 25000

// Set profit target and stop loss levels
SET $PROFIT_TARGET = 1000
SET $STOP_LOSS = 500

// Use the variables in your logic
IF $PROFIT > $PROFIT_TARGET THEN SELL $ALL @ $MARKET_PRICE
IF $PROFIT < -$STOP_LOSS THEN SELL $ALL @ $MARKET_PRICE
EXIT (Stop Script Execution)
The EXIT command immediately pauses your script. When a script encounters EXIT, it halts execution and changes its status to "paused." This is useful for emergency conditions or when you want to stop trading after a specific event.
// Exit script after losing more than $500
IF $PROFIT < -500 THEN EXIT

// Exit after completing 10 buy trades
IF $BUY_TRADE_COUNT >= 10 THEN EXIT

// Exit if market price drops too far
IF $MARKET_PRICE < 50 THEN EXIT
Important
Once a script is paused via EXIT, you must manually restart it from the dashboard. EXIT does not sell your existing position—it simply halts further script execution. If you want to sell and exit, use SELL followed by EXIT.
Decimal Precision & Value Types
DipSkip uses industry-standard decimal precision for all financial calculations. Understanding these precision levels ensures your scripts behave exactly as expected, especially when working with penny stocks or precise price targets.
| Value Type | Precision | Examples |
|---|---|---|
| Stock Prices | 4 decimal places | $0.1899, $152.4575 |
| Dollar Amounts (profit, cost, cash) |
2 decimal places | $1,234.56, -$50.00 |
| Share Quantities | Whole numbers only | 100, 50, 1 |
| Percentages | 2 decimal places | 15.75%, -2.50% |
Why 4 Decimals for Prices?
SEC Rule 612 allows sub-penny pricing for stocks trading under $1.00. This means penny stocks and OTC securities can have prices like $0.1875 or $0.0023. DipSkip preserves this precision to ensure accurate order execution and price comparisons.
Whole Shares Only
DipSkip currently supports whole share quantities only (no fractional shares). When you use
$MAX or calculate quantities, they are always rounded down to whole numbers.
For example, if you can afford 10.7 shares, DipSkip will buy 10 shares.
Tip: Market Orders
When using $MARKET_PRICE in your scripts, the order executes as a true market order.
The 4-decimal precision ensures your script correctly identifies when you're trading at market
price versus a specific limit price.
Macro Variables
DipScript supports macro variables—variables that contain expressions with other variables. When a macro variable is used, DipScript recursively resolves all nested variables until the final value is calculated. This powerful feature lets you create reusable condition shortcuts and complex expressions.
Basic Macro Syntax
Create a macro by setting a variable to an expression that contains other variables. When that variable is used later, DipScript will expand and resolve all nested variables automatically.
// Define a macro that checks if we have enough capital to enter
SET $HAS_CAPITAL = $BUYING_POWER >= 5000

// Define a dynamic entry price based on market conditions
SET $ENTRY_PRICE = $LAST_SELL_PRICE - 2% OR $MARKET_PRICE

// Use macros in your trading logic - variables resolve recursively
IF $LAST_BUY_PRICE = NULL AND $HAS_CAPITAL THEN OBTAIN USD 5000 @ $ENTRY_PRICE
How Recursive Resolution Works
Resolution Process
When DipScript encounters a variable like $HAS_CAPITAL, it expands to
$BUYING_POWER >= 5000. Then it resolves
$BUYING_POWER to its actual value
(e.g., 8200 >= 5000). This continues until all variables are resolved.
Depth limit: To prevent infinite loops (e.g., if $A references $B
and $B references $A), DipScript limits recursive resolution to 10 levels.
Practical Examples
Macros are especially useful for creating readable, maintainable strategies by giving meaningful names to complex conditions.
// Create a trailing stop condition macro
SET $TRAILING_STOP_HIT = $PROFIT > 500 AND $PROFIT < $PEAK_PROFIT - 2%

// Create a "buy the dip" condition
SET $DIP_DETECTED = $MARKET_PRICE < $PEAK_PRICE - 5%

// Create a position size macro based on account size
SET $POSITION_SIZE = $ACCOUNT_EQUITY * 10%

// Use the macros for cleaner, more readable strategies
IF $TRAILING_STOP_HIT THEN SELL $ALL @ $MARKET_PRICE
IF $DIP_DETECTED AND $ALL = 0 THEN OBTAIN USD $POSITION_SIZE
Benefits of Using Macros
- Readability: Replace complex conditions with meaningful names like
$HAS_CAPITALor$DIP_DETECTED - Maintainability: Change a condition in one place and it applies everywhere the macro is used
- Reusability: Define common trading patterns once and use them across multiple rules
- Organization: Keep all your parameters and conditions at the top of your script for easy tuning
Avoid Circular References
Be careful not to create circular references where $A depends on $B and $B depends on $A.
DipScript will stop resolution after 10 levels and log a warning if this occurs.
USD-Based Trading
DipScript supports USD-based orders, which let you specify a dollar amount to invest instead of a specific share count. This is useful for high-priced stocks or when you want to invest a fixed dollar amount.
Important: Rounding Behavior
DipScript does not support true fractional shares. When you specify a USD amount, DipScript calculates how many shares your dollar amount can buy at the current market price, then rounds down to the nearest whole share. For example, if $1,000 at a $95/share price equals 10.52 shares, DipScript will purchase exactly 10 shares.
When to Use USD Syntax
- High-priced stocks: Invest $10,000 instead of calculating how many shares that buys
- Fixed dollar amounts: Maintain consistent position sizes across different stocks
- Dollar cost averaging: Invest the same dollar amount on a recurring schedule
USD Syntax Example
Use the USD keyword before a dollar amount to specify investment size by value instead of share count.
TICKER NVDA

// SET INVESTMENT AMOUNT IN DOLLARS
SET $BUY_AMOUNT_USD = 25000

// INITIAL PURCHASE: BUY $25,000 WORTH (ROUNDS DOWN TO WHOLE SHARES)
IF $LAST_BUY_PRICE = NULL THEN OBTAIN USD $BUY_AMOUNT_USD

// TAKE PROFIT WHEN UP $1000
IF $PROFIT > 1000 THEN SELL $ALL @ $MARKET_PRICE

// BUY THE DIP WITH ANOTHER $25,000
IF $MARKET_PRICE < $LAST_SELL_PRICE - 3% THEN OBTAIN USD $BUY_AMOUNT_USD
How It Works
When you use OBTAIN USD 5000 at a stock price of $142.50, DipScript calculates
the target position: 5000 ÷ 142.50 = 35.09 shares → rounds down → targets 35 shares.
Like all OBTAIN commands, it only buys what's needed to reach this target. If you already
own 20 shares, it buys 15 more. If you own 35+, it does nothing.
USD Syntax Limitations
- Rounds down: Always calculates whole shares only, fractional amounts are discarded
- Market price only: USD orders always execute at market price (no custom limit prices)
- OBTAIN only: The USD keyword only works with OBTAIN commands, not SELL
- Target position: Like all OBTAIN commands, only buys what's needed to reach the target
- Selling: To sell your position, use
SELL $ALL @ $MARKET_PRICE
Conditional Logic
IF statements are the heart of your trading strategy. They define when actions happen based on market conditions, profit levels, and position data. Think of them as automated decision-making.
Comparison Operators
Use these operators to compare values and create trading conditions. Boolean variables like $IS_UPTREND_5 can also be used directly without an operator — non-zero values are true, zero is false. Use NOT to negate: IF NOT $IS_DOWNTREND_10 THEN ...
| Operator | Description | Example |
|---|---|---|
| > | Greater than | $PROFIT > 500 |
| < | Less than | $MARKET_PRICE < 150 |
| >= | Greater than or equal | $PROFIT >= 1000 |
| <= | Less than or equal | $ALL <= 100 |
| = | Equal to | $ALL = 0 |
| != | Not equal to | $LAST_BUY_PRICE != NULL |
Logical Operators
AND Logic (Combining Conditions)
Use AND when you need multiple conditions to be true before taking action. This helps create more precise entry and exit rules.
// Only buy if you have no position AND price has dropped
IF $ALL = 0 AND $MARKET_PRICE <= $LAST_SELL_PRICE - 2.5% THEN OBTAIN 400 @ $MARKET_PRICE

// Sell only when profitable AND showing weakness (trailing stop logic)
IF $PROFIT > 200 AND $PROFIT < $PEAK_PROFIT - 100 THEN SELL $ALL @ $MARKET_PRICE

// Limit position size: only add shares if below max AND price is right
IF $ALL < 500 AND $MARKET_PRICE < $LAST_BUY_PRICE - 5% THEN OBTAIN 100 @ $MARKET_PRICE
NOT Logic (Negation)
Use NOT to negate a condition. This is especially useful with boolean variables like trend detection.
// Buy when uptrending and NOT downtrending
IF $IS_UPTREND_10 AND NOT $IS_DOWNTREND_10 THEN OBTAIN $MAX @ $MARKET_PRICE

// Sell when the uptrend ends
IF NOT $IS_UPTREND_10 AND $ALL != 0 THEN SELL $ALL @ $MARKET_PRICE
OR Logic (Alternative Conditions)
Use OR when either condition being true should trigger the action. Multiple ORs are allowed.
// Buy if uptrending OR price is near a low
IF $IS_UPTREND_5 OR $MARKET_PRICE < $LOWEST_PRICE + 1% THEN OBTAIN 100 @ $MARKET_PRICE
OR also works as a fallback when variables might be NULL — if the left side fails, the right side is used:
// Use $PEAK_PROFIT if available, otherwise use 600 as the fallback
IF $PROFIT < $PEAK_PROFIT - 100 OR 600 THEN SELL $ALL @ $MARKET_PRICE
Parenthesized Grouping
Use parentheses to group conditions and control evaluation order. Without parentheses, AND binds tighter than OR (like in math, multiplication before addition).
// Group OR conditions with AND — parentheses required here
IF $ALL = 0 AND ($IS_UPTREND_5 OR $MARKET_PRICE > $LOWEST_PRICE + 0.8%) THEN OBTAIN $MAX @ $MARKET_PRICE

// Negate an entire group
IF NOT ($IS_DOWNTREND_5 AND $IS_DOWNTREND_10) THEN OBTAIN $MAX @ $MARKET_PRICE

// Nested parentheses
IF $PROFIT > 0 AND ($IS_DOWNTREND_10 OR ($PROFIT > 500 AND $PROFIT < $PEAK_PROFIT - 20%)) THEN SELL $ALL @ $MARKET_PRICE
Parentheses: Math vs. Conditions
Parentheses work in both math expressions and condition grouping:
- Math:
($MARKET_PRICE + 10) * 2— evaluated as arithmetic - Conditions:
($A OR $B) AND $C— groups logical conditions
NULL Value Handling
Understanding NULL
Variables are NULL when they don't have a value yet. For example, $LAST_SELL_PRICE is NULL
if you haven't sold anything yet. $PEAK_PROFIT is NULL before you've made any profit.
Without OR fallback: If a variable is NULL and you don't provide an OR fallback, the entire IF condition evaluates to false and won't execute.
With OR fallback: If the expression before OR results in NULL or error, DipScript uses the value after OR instead.
Comparing with NULL
When checking if a variable is NULL, you can only use = (equals) or != (not equals).
Other comparison operators like >, <, >=, <=
don't work with NULL and will cause unexpected behavior.
Correct: IF $LAST_BUY_PRICE = NULL THEN ...
Correct: IF $LAST_BUY_PRICE != NULL THEN ...
Avoid: IF $LAST_BUY_PRICE > NULL THEN ... (won't work as expected)
// Check if you've never bought before (NULL means never traded)
IF $LAST_BUY_PRICE = NULL THEN OBTAIN 100 @ $MARKET_PRICE

// Check if you've sold before (not NULL means you have)
IF $LAST_SELL_PRICE != NULL THEN OBTAIN 50 @ $MARKET_PRICE
Math Operations & Smart Percentages
DipScript supports mathematical expressions for dynamic pricing strategies. One of the most powerful features is the "smart percentage" system that automatically calculates percentage changes.
Basic Math Operations
| Operator | Description | Example |
|---|---|---|
| + | Addition | $MARKET_PRICE + 10 |
| - | Subtraction | $PROFIT - 100 |
| * | Multiplication | $MAX * 0.5 |
| / | Division | $ALL / 2 |
Smart Percentage System
This is where DipScript really shines. When you use a percentage with addition or subtraction, DipScript automatically applies it to the base value. You don't have to calculate anything manually.
How Smart Percentages Work
When you write $MARKET_PRICE - 5%, DipScript automatically means:
"Take the market price and subtract 5% OF the market price"
It's multiplicative, not literal. The percentage is always calculated from the base value before the operator.
$MARKET_PRICE - 5%= $95
Calculation: 100 - (5% of 100) = 100 - 5 = 95$MARKET_PRICE + 10%= $110
Calculation: 100 + (10% of 100) = 100 + 10 = 110$MARKET_PRICE - 2.5%= $97.50
Calculation: 100 - (2.5% of 100) = 100 - 2.5 = 97.50$LAST_BUY_PRICE + 15%(if last buy was $80) = $92
Calculation: 80 + (15% of 80) = 80 + 12 = 92
Practical Percentage Applications
Smart percentages make complex strategies simple to write:
// Buy at 2% below current market price
OBTAIN 100 @ $MARKET_PRICE - 2%

// Sell at 5% above current market price
SELL $ALL @ $MARKET_PRICE + 5%

// Buy when price drops 10% below last sell
IF $MARKET_PRICE <= $LAST_SELL_PRICE - 10% THEN OBTAIN 200 @ $MARKET_PRICE

// Take profit at 20% gain from buy price
IF $MARKET_PRICE >= $LAST_BUY_PRICE + 20% THEN SELL $ALL @ $MARKET_PRICE

// Combine percentage and fixed amount: 5% below market plus $1.25
OBTAIN 50 @ $MARKET_PRICE - 5% + 1.25
Calculating Profit Percentages
Since DipScript uses dollar-based profit variables, you can calculate percentage gains by comparing profit to investment:
// Sell when profit exceeds 20% of invested amount
// This means: profit > (invested * 20%)
IF $PROFIT > $AMOUNT_INVESTED_SINCE_LAST_TRADE * 20% THEN SELL $ALL @ $MARKET_PRICE

// Stop loss when down 10% of invested amount
IF $PROFIT < $AMOUNT_INVESTED_SINCE_LAST_TRADE * -10% THEN SELL $ALL @ $MARKET_PRICE

// Check if total profit exceeds 15% of total invested
IF $TOTAL_PROFIT > $TOTAL_AMOUNT_INVESTED * 15% THEN SELL $ALL @ $MARKET_PRICE
Warning: Never Use Standalone Percentages in Comparisons
A standalone percentage like 5% evaluates to 0.05, not 5% of something!
Percentages only become "smart" when preceded by +, -, or *.
WRONG:
// This means "$PROFIT > 0.05" (5 cents!) - ALWAYS TRUE!
IF $PROFIT > 5% THEN SELL $ALL @ $MARKET_PRICE
CORRECT:
// Take profit when gain exceeds 5% of investment
IF $PROFIT > $AMOUNT_INVESTED_SINCE_LAST_TRADE * 5% THEN SELL $ALL @ $MARKET_PRICE
When comparing dollar values (like $PROFIT) to a percentage, always use
* X% to calculate X% of another value.
Day Trading with DipScript
Day trading is all about speed, precision, and discipline. You're making multiple trades within a single day, trying to profit from small price movements. DipScript automates the execution so you can focus on strategy instead of manually placing orders.
Why Automation Matters for Day Trading
Day trading windows are small. A stock might spike for 30 seconds before reversing. By the time you manually calculate your profit, decide to sell, and place the order, the opportunity is gone. DipScript executes in milliseconds.
TICKER TSLA

// Initial entry: buy if we have no position
IF $ALL = 0 AND $LAST_BUY_PRICE = NULL THEN OBTAIN 100 @ $MARKET_PRICE

// Quick profit taking: sell when up $300
IF $PROFIT > 300 THEN SELL $ALL @ $MARKET_PRICE

// Re-entry: buy the dip after selling (if price drops 1.5%)
IF $ALL = 0 AND $MARKET_PRICE <= $LAST_SELL_PRICE - 1.5% THEN OBTAIN 100 @ $MARKET_PRICE

// Safety stop: cut losses if down $150
IF $PROFIT < -150 THEN SELL $ALL @ $MARKET_PRICE
This strategy will automatically cycle through buying and selling all day long, capturing $300 profits and limiting losses to $150. No manual intervention needed.
Key Day Trading Principles
- Have a Plan: Know your entry, exit, and stop loss before the market opens
- Risk Management: Always set stop losses. Protect your capital first
- Take Profits: Don't get greedy. Small consistent wins compound
- Limit Exposure: Don't hold positions overnight if you're day trading
- Volume Matters: Day trade liquid stocks with high volume for better execution
Scalping Strategies
Scalping is high-frequency day trading. You're making dozens or hundreds of trades, capturing tiny profit margins on each. This requires automation—no human can execute scalping strategies manually at scale.
What is Scalping?
Scalpers aim for small profits per trade (often $50-$200) but make many trades. If you make 20 trades per day averaging $100 profit each, that's $2,000 daily. DipScript is perfect for this because it executes instantly when your profit targets hit.
TICKER SPY

// Configuration
SET $POSITION_SIZE = 200
SET $PROFIT_TARGET = 100
SET $STOP_LOSS = 50

// Entry: buy when flat
IF $ALL = 0 THEN OBTAIN $POSITION_SIZE @ $MARKET_PRICE

// Take profit at target
IF $PROFIT >= $PROFIT_TARGET THEN SELL $ALL @ $MARKET_PRICE

// Stop loss at limit
IF $PROFIT <= -$STOP_LOSS THEN SELL $ALL @ $MARKET_PRICE
This strategy immediately re-enters after every exit, running continuously. With a 2:1 profit-to-loss ratio, you only need to win 34% of trades to break even. Anything above that is profit.
Advanced Scalping: Pyramiding Profits
As you build profit, you can take partial exits to lock in gains while leaving some position to run:
TICKER QQQ

// Enter with 300 shares
IF $ALL = 0 THEN OBTAIN 300 @ $MARKET_PRICE

// Sell 1/3 when up $100 (lock in some profit)
IF $PROFIT >= 100 AND $SELL_TRADE_COUNT = 0 THEN SELL 100 @ $MARKET_PRICE

// Sell another 1/3 when up $200
IF $PROFIT >= 200 AND $SELL_TRADE_COUNT = 1 THEN SELL 100 @ $MARKET_PRICE

// Let the final 1/3 run to $300 or trailing stop
IF $PROFIT >= 300 THEN SELL $ALL @ $MARKET_PRICE

// Trailing stop: protect profits if price reverses
IF $PROFIT < $PEAK_PROFIT - 75 THEN SELL $ALL @ $MARKET_PRICE

// Hard stop: maximum loss limit
IF $PROFIT < -60 THEN SELL $ALL @ $MARKET_PRICE
Momentum Trading
Momentum trading captures sustained price moves. Instead of quick scalps, you're riding trends that might last hours or days. DipScript helps you enter breakouts automatically and protect profits with trailing stops.
Momentum Trading Principles
- Trend is Your Friend: Only trade in the direction of strong moves
- Breakouts: Enter when price breaks above resistance or below support
- Trailing Stops: Let profits run but protect against reversals
- Volume Confirmation: Strong momentum comes with high volume
TICKER NVDA

// Enter when price breaks above recent peak by 2%
IF $ALL = 0 AND $MARKET_PRICE > $PEAK_PRICE + 2% THEN OBTAIN 150 @ $MARKET_PRICE

// Add to position on continued strength (pyramiding)
IF $ALL > 0 AND $ALL < 300 AND $PROFIT > $AMOUNT_INVESTED_SINCE_LAST_TRADE * 5% THEN OBTAIN 75 @ $MARKET_PRICE

// Trailing stop: exit if profit drops 8% from peak
IF $PROFIT > 0 AND $PROFIT <= $PEAK_PROFIT - $PEAK_PROFIT * 8% THEN SELL $ALL @ $MARKET_PRICE

// Hard stop: cut losses at 10% down
IF $PROFIT < $AMOUNT_INVESTED_SINCE_LAST_TRADE * -10% THEN SELL $ALL @ $MARKET_PRICE
This strategy waits for confirmation of upward momentum before entering, adds to winning positions, and uses a percentage-based trailing stop to lock in profits as the trend continues.
Risk Management
Risk management is what separates profitable traders from those who blow up their accounts. No matter how good your strategy is, you need rules to protect your capital.
Essential Risk Controls
1. Always Use Stop Losses
Every strategy should have a maximum loss limit. Never let a losing trade run indefinitely.
// Fixed dollar stop loss
IF $PROFIT < -500 THEN SELL $ALL @ $MARKET_PRICE

// Percentage-based stop loss (10% of investment)
IF $PROFIT < $AMOUNT_INVESTED_SINCE_LAST_TRADE * -10% THEN SELL $ALL @ $MARKET_PRICE
2. Position Sizing
Don't put all your capital into a single trade. Limit position sizes to manage risk.
// Use 25% of available capital instead of maximum
IF $ALL = 0 THEN OBTAIN $MAX / 4 @ $MARKET_PRICE

// Or use a fixed maximum position size
SET $MAX_POSITION = 200
IF $ALL = 0 THEN OBTAIN $MAX_POSITION @ $MARKET_PRICE
3. Limit Number of Trades
Prevent overtrading by capping how many times you can enter a position.
// Only allow 5 buy trades total
IF $BUY_TRADE_COUNT < 5 AND $ALL = 0 THEN OBTAIN 100 @ $MARKET_PRICE
4. Profit Protection with Trailing Stops
Once profitable, use trailing stops to lock in gains while allowing for continued upside.
// Once up $200, exit if profit drops by $100 from peak
IF $PROFIT > 200 AND $PROFIT < $PEAK_PROFIT - 100 THEN SELL $ALL @ $MARKET_PRICE
Complete Risk-Managed Strategy Example
TICKER AAPL

// Configuration: all risk parameters in one place
SET $POSITION_SIZE = 100
SET $PROFIT_TARGET = 500
SET $STOP_LOSS = 250
SET $MAX_TRADES = 10

// Entry with trade limit
IF $ALL = 0 AND $BUY_TRADE_COUNT < $MAX_TRADES THEN OBTAIN $POSITION_SIZE @ $MARKET_PRICE

// Profit taking
IF $PROFIT >= $PROFIT_TARGET THEN SELL $ALL @ $MARKET_PRICE

// Stop loss
IF $PROFIT <= -$STOP_LOSS THEN SELL $ALL @ $MARKET_PRICE

// Trailing stop: protect profits once up $300
IF $PROFIT > 300 AND $PROFIT < $PEAK_PROFIT - 150 THEN SELL $ALL @ $MARKET_PRICE
Risk Management Reality Check
Even with perfect execution, trading involves risk. DipScript helps you stick to your rules, but it can't eliminate market risk. Only risk capital you can afford to lose. Consider starting with paper trading or small positions to test strategies before scaling up.
Common Patterns
These patterns form the building blocks of most trading strategies. Mix and match them to create your custom approach.
Entry Strategies
// Initial position entry (first time buying)
IF $LAST_BUY_PRICE = NULL THEN OBTAIN 100 @ $MARKET_PRICE

// Dollar cost averaging (buy more on dips)
IF $MARKET_PRICE <= $LAST_BUY_PRICE - 5% THEN OBTAIN 50 @ $MARKET_PRICE

// Breakout buying (enter on strength)
IF $MARKET_PRICE > $PEAK_PRICE + 3% THEN OBTAIN 100 @ $MARKET_PRICE

// Dip buying after selling (buy back cheaper)
IF $ALL = 0 AND $MARKET_PRICE <= $LAST_SELL_PRICE - 2% THEN OBTAIN 200 @ $MARKET_PRICE
Exit Strategies
// Fixed dollar profit target
IF $PROFIT >= 1000 THEN SELL $ALL @ $MARKET_PRICE

// Percentage-based profit target (20% gain)
IF $PROFIT > $AMOUNT_INVESTED_SINCE_LAST_TRADE * 20% THEN SELL $ALL @ $MARKET_PRICE

// Fixed dollar stop loss
IF $PROFIT <= -500 THEN SELL $ALL @ $MARKET_PRICE

// Trailing stop (exit if profit drops from peak)
IF $PROFIT <= $PEAK_PROFIT - 200 THEN SELL $ALL @ $MARKET_PRICE

// Partial exit (take some profit, let rest run)
IF $PROFIT > $AMOUNT_INVESTED_SINCE_LAST_TRADE * 10% THEN SELL $ALL / 2 @ $MARKET_PRICE
Position Management
// Position sizing based on available capital (use 25%)
IF $ALL = 0 THEN OBTAIN $MAX / 4 @ $MARKET_PRICE

// Limit number of buy transactions
IF $BUY_TRADE_COUNT < 3 AND $PROFIT > $AMOUNT_INVESTED_SINCE_LAST_TRADE * 5% THEN OBTAIN 50 @ $MARKET_PRICE

// Scale out in portions (tiered exits)
IF $PROFIT > $AMOUNT_INVESTED_SINCE_LAST_TRADE * 20% AND $SELL_TRADE_COUNT = 0 THEN SELL $ALL / 3 @ $MARKET_PRICE
Strategy Examples
Complete strategy implementations demonstrating different trading approaches. Use these as templates and customize to fit your style.
Conservative Dollar Cost Averaging
TICKER AAPL

// Initial purchase
IF $LAST_BUY_PRICE = NULL THEN OBTAIN 50 @ $MARKET_PRICE

// Add to position on 5% dips (dollar cost averaging)
IF $ALL > 0 AND $MARKET_PRICE <= $LAST_BUY_PRICE - 5% THEN OBTAIN 25 @ $MARKET_PRICE

// Take profit at 20% gain
IF $PROFIT > $AMOUNT_INVESTED_SINCE_LAST_TRADE * 20% THEN SELL $ALL @ $MARKET_PRICE

// Stop loss at 15% down
IF $PROFIT < $AMOUNT_INVESTED_SINCE_LAST_TRADE * -15% THEN SELL $ALL @ $MARKET_PRICE
Momentum Breakout Strategy
TICKER TSLA

// Enter on breakout above recent high
IF $ALL = 0 AND $MARKET_PRICE > $PEAK_PRICE + 2% THEN OBTAIN 100 @ $MARKET_PRICE

// Add to position on continued momentum (pyramiding)
IF $ALL > 0 AND $ALL < 200 AND $PROFIT > $AMOUNT_INVESTED_SINCE_LAST_TRADE * 5% THEN OBTAIN 50 @ $MARKET_PRICE

// Trailing stop: sell if profit drops 8% from peak
IF $PROFIT > 0 AND $PROFIT <= $PEAK_PROFIT - $PEAK_PROFIT * 8% THEN SELL $ALL @ $MARKET_PRICE

// Hard stop loss at 12%
IF $PROFIT < $AMOUNT_INVESTED_SINCE_LAST_TRADE * -12% THEN SELL $ALL @ $MARKET_PRICE
Best Practices
Guidelines for writing effective and maintainable DipScript strategies that perform well in real trading conditions.
Strategy Design
- Start Simple: Begin with basic buy/sell rules and add complexity gradually as you understand performance
- Define Clear Entry/Exit Rules: Every strategy should have explicit conditions for entering and exiting positions
- Include Risk Management: Always implement stop losses and position limits before going live
- Test Edge Cases: Consider NULL values, first trades, and extreme market conditions in your logic
- Use Variables for Parameters: SET commands make it easy to adjust profit targets and stop losses
- Comment Your Code: Future you will thank present you for explaining complex logic
Important Risk Considerations
Always include appropriate risk controls in your strategies. Consider position sizing, stop losses, maximum drawdown limits, and trade count limits when designing strategies. Never risk more than you can afford to lose on a single trade or strategy.
TICKER QQQ

// ============================================
// STRATEGY PARAMETERS (adjust these as needed)
// ============================================
SET $POSITION_SIZE = 200
SET $PROFIT_TARGET = 800
SET $STOP_LOSS = 400
SET $TRAILING_STOP = 150

// ============================================
// ENTRY LOGIC
// ============================================
IF $LAST_BUY_PRICE = NULL THEN OBTAIN $POSITION_SIZE @ $MARKET_PRICE

// ============================================
// RISK MANAGEMENT - STOP LOSS (most important!)
// ============================================
IF $PROFIT <= -$STOP_LOSS THEN SELL $ALL @ $MARKET_PRICE

// ============================================
// PROFIT TAKING
// ============================================
IF $PROFIT >= $PROFIT_TARGET THEN SELL $ALL @ $MARKET_PRICE

// Trailing stop once profitable
IF $PROFIT > 200 AND $PROFIT < $PEAK_PROFIT - $TRAILING_STOP THEN SELL $ALL @ $MARKET_PRICE

// ============================================
// RE-ENTRY LOGIC
// ============================================
IF $ALL = 0 AND $MARKET_PRICE <= $LAST_SELL_PRICE - 3% THEN OBTAIN $POSITION_SIZE @ $MARKET_PRICE
Testing and Validation
- Paper Trade First: Test strategies with virtual money before risking real capital
- Start Small: When going live, start with smaller position sizes
- Monitor Closely: Watch your first few trades execute to ensure logic works as expected
- Keep Records: Track what strategies work and what doesn't
Order Execution
Understanding how DipSkip executes and tracks your stock orders is essential for building reliable trading strategies.
Order Lifecycle
When your DipScript triggers a buy or sell order, the following process occurs:
Order Execution Flow
- Order Submission: Your order is submitted to the broker (Tradier)
- Synchronous Waiting: The script waits for the order to fill, polling every 5 seconds
- If Filled: Order details are recorded and your script variables are updated immediately
- If Timeout Reached: The order is cancelled and the script continues execution
- If Cancel Fails: The script is paused and you receive an email notification
Pending Order Detection
DipScripts run on a continuous loop. The execution frequency depends on your subscription tier. If an order is still pending when your script runs again, the system automatically detects this and prevents duplicate orders from being placed.
- Buy Orders: If a pending buy order exists for the ticker, new buy orders are blocked
- Sell Orders: Anti-shorting protection prevents selling more shares than you own minus any pending sell quantity
Order Timeouts
You can configure how long the system waits for an order to fill before cancelling it. This setting is found in the Settings tab under "Order Fill Timeout".
- Range: 1 to 5 minutes
- Default: 5 minutes
If the timeout is reached, the system attempts to cancel the order with retry logic (up to 10 attempts). If cancellation succeeds, the script continues. If cancellation fails after all retries, the script is paused and you receive an email notification requiring manual intervention.
Partial Fills at Timeout
If your order is partially filled when the timeout occurs (for example, you ordered 100 shares but only 60 filled), DipSkip will:
- Cancel the remaining unfilled portion (40 shares in this example)
- Keep the shares that did fill—they're now part of your position
- Update your script variables to reflect the partial fill
Your script will continue running with the shares you received. On the next execution cycle, it may place another order if your entry conditions are still met.
Important: Limit Orders
The timeout applies to all orders. If you're using limit orders that may take longer to fill, be aware they will be cancelled if not filled within your configured timeout. For longer-term limit orders, consider managing them directly through your broker.
Tradier Connection
DipSkip uses Tradier as the brokerage connection for executing trades. Tradier is a modern, API-first brokerage designed for automated and algorithmic trading.
Tradier Pricing
Tradier uses a subscription-based pricing model with three tiers. All plans have a $0 account minimum for brokerage accounts. Visit tradier.com/individuals/pricing for the latest details.
- Stocks & ETFs$0.35 / trade
- Equity & ETF Options$0.35 / contract
- Index Options$0.35 / contract
- Assignment / Exercise$9.00
- IRA Fee$30 / year
- Stocks & ETFsCommission-free
- Equity & ETF OptionsCommission-free
- Index Options$0.35 / contract
- Assignment / Exercise$9.00
- IRA FeeWaived
- Stocks & ETFsCommission-free
- Equity & ETF OptionsCommission-free
- Index Options$0.10 / contract
- Assignment / Exercise$5.00
- IRA FeeWaived
Additional fees apply across all plans: clearing fees of $0.0775 per contract ($15 per leg max), and standard SEC regulatory fees on sell transactions. New Tradier customers can get two months of Pro or Pro Plus free with a $500 minimum deposit — check Tradier's pricing page for current promotions.
Creating a Tradier Account
Before connecting DipSkip to your brokerage, you'll need to create a Tradier account:
- Visit tradier.com and click Open an Account
- Select Individual Brokerage Account as your account type
- Complete the application with your personal information, including:
- Full legal name and contact information
- Social Security Number (required for tax reporting)
- Employment information
- Investment experience and objectives
- Review and sign the account agreements electronically
- Fund your account via bank transfer (ACH), wire transfer, or account transfer
Account Approval
Tradier approves accounts within 1-2 business days according to their documentation. You'll receive an email confirmation once your account is ready for trading.
Connecting Your Tradier Account to DipSkip
Once your Tradier account is approved and funded, you can connect it to DipSkip:
- Log in to DipSkip and navigate to the User tab in the sidebar
- In the Account Setup section, locate the Trading Connection card
- Click the Connect button to initiate the OAuth connection
- You'll be redirected to Tradier's secure login page
- Enter your Tradier credentials and authorize DipSkip to access your account
- After authorization, you'll be redirected back to DipSkip with a Connected status
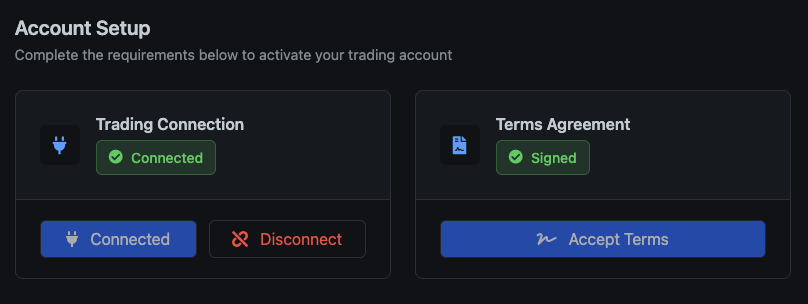
The Account Setup section shows your connection status. Once connected, you'll see a green Connected badge. You can disconnect at any time by clicking the Disconnect button.
Terms Agreement Required
Before you can run trading scripts, you must also accept the DipSkip Terms of Service by clicking Accept Terms in the Terms Agreement card. Both the trading connection and terms agreement must be completed to activate your account.
Paper Trading Mode
DipSkip supports paper trading (simulated trading) so you can test your strategies without risking real money. Toggle paper trading mode in the Settings tab. When enabled, all trades are simulated using real market data but no actual orders are placed.
Realistic Order Simulation
Paper trading is designed to closely mirror live Tradier trading behavior while keeping order execution fast for testing. Orders fill immediately but include realistic price adjustments.
Price Slippage
Market orders include realistic slippage simulation to mimic the bid-ask spread:
- Buy orders: Fill at slightly higher than the quoted price (up to +0.1%)
- Sell orders: Fill at slightly lower than the quoted price (up to -0.1%)
This means your Avg Fill Price (shown in Portfolio) may differ from the Current Price. This is intentional and reflects real-world trading conditions where market orders execute at the best available price, not the exact quoted price.
Example: If you buy 100 shares when the price is $50.00, you might fill at $50.05 due to slippage. Your position will immediately show a small loss until the market price rises above your fill price.
Margin Account for Day Trading
By default, Tradier accounts are set up as cash accounts. While cash accounts work fine for swing trading and longer-term strategies, they have a significant limitation for day trading: trade settlement.
Understanding Trade Settlement
When you sell a stock in a cash account, the funds from that sale take T+1 (one business day) to settle. Until the funds settle, you cannot use them to make new purchases. This means:
- If you buy and sell a stock on Monday, those funds aren't available until Tuesday
- Attempting to use unsettled funds results in a Good Faith Violation
- Multiple violations can result in account restrictions
Why You Need a Margin Account
A margin account eliminates the settlement waiting period. With margin:
- Funds are immediately available after selling a position
- You can execute multiple round-trip trades in a single day
- No Good Faith Violations for using proceeds from recent sales
Margin ≠ Borrowing
Having a margin account doesn't mean you have to trade on borrowed money. You can still trade using only your own cash—the margin account simply removes the settlement delay. DipSkip's default behavior uses only your available cash balance.
Applying for Margin on Tradier
To upgrade your Tradier cash account to a margin account:
- Log in to your account at dash.tradier.com
- Navigate to Account → Settings or Account Features
- Look for Margin Trading or Account Upgrade options
- Complete the margin application, which includes:
- Acknowledging the risks of margin trading
- Confirming your investment experience
- Signing the margin agreement
- Wait for approval (1-2 business days according to Tradier)
Alternative: Paper Trading
If you want to practice day trading strategies without margin requirements, use DipSkip's paper trading mode. Paper trading simulates real market conditions without any of the regulatory limitations, making it perfect for strategy development and testing.
Fingerprint Login
DipSkip uses Google Sign-In for authentication, which means you can take advantage of Google's Passkeys feature to log in using your fingerprint or Face ID instead of typing your password every time.
What are Passkeys?
Passkeys are a modern, more secure alternative to passwords. Instead of remembering and typing a password, you authenticate using your device's biometrics (fingerprint or face recognition). Passkeys are:
- More Secure: Cannot be phished or stolen like passwords
- Faster: Just touch your fingerprint sensor or look at your phone
- Convenient: No passwords to remember or type
Setting Up Fingerprint Login
To enable fingerprint login for DipSkip, you need to set up a passkey on your Google account:
- Visit myaccount.google.com on your phone or computer
- Sign in to your Google account if prompted
- Navigate to Security in the left sidebar
- Scroll down to find Passkeys (under "How you sign in to Google")
- Click Create a passkey
- Follow the prompts to register your device's biometric (fingerprint or Face ID)
- Your passkey is now set up!
Device Requirements
Passkeys work on most modern devices with biometric sensors:
- iPhone: Touch ID or Face ID (iOS 16+)
- Android: Fingerprint sensor (Android 9+)
- Mac: Touch ID on MacBook Pro/Air
- Windows: Windows Hello (fingerprint or facial recognition)
Using Fingerprint Login on DipSkip
Once you've set up a passkey on your Google account, logging into DipSkip becomes seamless:
- Open DipSkip and tap Sign in with Google
- Google will detect your passkey and prompt for biometric verification
- Touch your fingerprint sensor or use Face ID
- You're logged in! No password required
Works on Mobile Too
Fingerprint login works great on the DipSkip mobile site. Just tap "Sign in with Google" and authenticate with your fingerprint—perfect for quick access to check your trades on the go.
Troubleshooting
If fingerprint login isn't working:
- Passkey not showing up: Make sure you created the passkey on the same device you're trying to sign in from
- Fingerprint not recognized: Try re-registering your fingerprint in your device's settings
- Browser issues: Passkeys work best in Chrome, Safari, and Edge. Firefox support is limited
- Still prompted for password: You can always fall back to password login if needed—passkeys are optional
Price Chart
The dashboard displays an interactive price chart for each of your running scripts, providing real-time visualization of price movements and key reference points. Understanding what each element represents helps you monitor your strategy's performance at a glance.
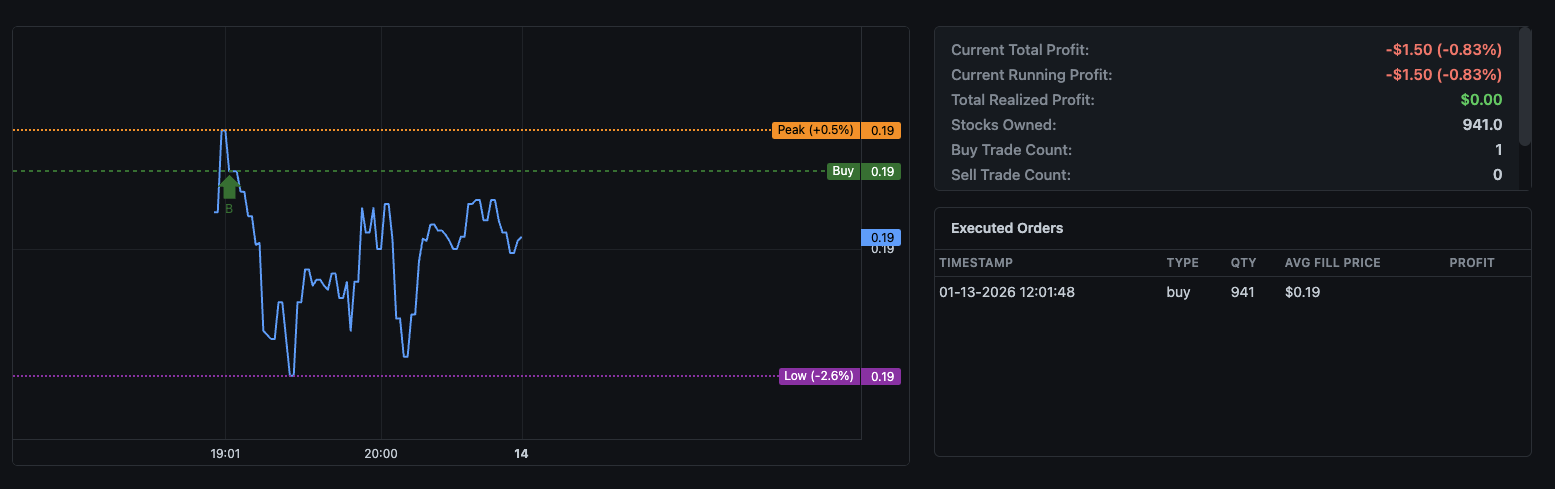
Price Line
The main blue line shows the stock's price movement over time. The chart automatically scales to show recent price action and updates in real-time during market hours. Hover over any point to see the exact price and timestamp.
Reference Lines
Three horizontal reference lines help you understand your position relative to key price levels:
- Buy Line (Green): Shows the price at which you entered your current position. This appears when your last executed order was a buy. The line is labeled "Buy" with the exact price on the right axis.
- Sell Line (Red): Shows the price at which you exited your last position. This appears when your last executed order was a sell. The line is labeled "Sell" with the exact price on the right axis.
- Peak Line (Orange): Tracks the highest price reached since your last buy. The label shows the percentage above your entry price, e.g., "Peak (+0.5%)" means the peak is 0.5% higher than your buy price. This resets each time you make a new purchase.
- Low Line (Purple): Tracks the lowest price reached since your last sell. The label shows the percentage below your sell price, e.g., "Low (-2.6%)" means the low is 2.6% below your sell price. This resets each time you sell.
Trade Markers
When trades execute, markers appear on the chart at the exact time and price:
- B (Green): Buy order executed at this point
- S (Red): Sell order executed at this point
Using the Chart Effectively
The percentage indicators on Peak and Low lines are especially useful for evaluating your strategy's performance:
- A high Peak percentage shows the maximum potential profit you could have captured
- Comparing Peak to current price shows how much profit has been given back
- The Low percentage helps evaluate whether your entry points are timing dips correctly
- Wide gaps between Peak and Low indicate high volatility—adjust your strategy accordingly
Script Metrics
Adjacent to the price chart, the dashboard displays real-time metrics for each running script. These statistics update automatically and provide a comprehensive view of your strategy's current state and historical performance.
Profit Metrics
- Current Total Profit: Your overall profit/loss combining both realized gains from completed trades and unrealized gains from open positions. Displayed in dollars and as a percentage of your invested capital.
- Current Running Profit: The unrealized profit/loss on your currently held shares. This fluctuates with the market price and becomes realized when you sell.
- Total Realized Profit: The sum of all profits and losses from completed trades. This only changes when you actually sell shares and lock in gains or losses.
Position Information
- Stocks Owned: The number of shares you currently hold in this position. Shows 0 when you have no open position.
- Buy Trade Count: Total number of buy orders executed by this script since it started running. Useful for understanding how active your strategy is.
- Sell Trade Count: Total number of sell orders executed by this script. Comparing buy and sell counts helps you understand position cycling frequency.
Executed Orders
Below the metrics, a table shows your recent order history for this script:
- Timestamp: Exact date and time the order was filled
- Type: Whether the order was a buy or sell
- QTY: Number of shares traded
- Avg Fill Price: The actual price at which the order executed
- Profit: For sell orders, the profit or loss realized on that trade
Monitoring Multiple Scripts
If you're running multiple scripts on different tickers, each one has its own independent chart and metrics panel. Scroll through your dashboard to monitor all active strategies, or use the script selector to focus on a specific one.
Alerts Overview
DipSkip's alerts system keeps you informed about important events without requiring you to constantly monitor the dashboard. Set up email notifications for price movements, profit/loss thresholds, and trade executions so you can stay on top of your strategies wherever you are.
Why Use Alerts?
While your scripts run autonomously, there are times when you want to know immediately about specific events:
- A stock you're watching hits your target entry price
- Your script executes a trade (buy or sell)
- Your position reaches a profit target or loss limit
- Market conditions trigger unusual activity in your strategy
Alerts bridge the gap between full automation and staying informed. You get the convenience of hands-off trading with the awareness of real-time notifications.
Email Delivery
All alerts are delivered via email to the address associated with your account. Make sure your email settings are correct in your account profile to receive notifications.
Alert Types
DipSkip supports five different alert types, each designed for specific monitoring needs. You can create multiple alerts of each type with different configurations.
Symbol Price Alert
Get notified when any stock reaches a specific price point. This alert type is independent of your scripts and monitors the market directly.
- Symbol: The stock ticker to watch (e.g., AAPL, NVDA, TSLA)
- Target Price: The price that triggers the alert
Use case: Set a symbol price alert for a stock you want to buy when it drops to a certain level, or to notify you when a watched stock breaks through resistance.
Loss Amount Alert
Receive a notification when the current loss on selected scripts reaches a threshold. You can set the threshold in either dollar amount or percentage terms.
- Amount: The loss value that triggers the alert
- Type: Choose between USD (e.g., -$50) or Percent (e.g., -5%)
- Scripts: Select which scripts to monitor for this alert
Use case: Set a loss alert at -10% to know immediately if a position moves significantly against you, giving you time to review and potentially intervene.
Gain Amount Alert
Get notified when the current profit on selected scripts reaches a target level. Configure in dollar amount or percentage.
- Amount: The profit value that triggers the alert
- Type: Choose between USD (e.g., $100) or Percent (e.g., +10%)
- Scripts: Select which scripts to monitor for this alert
Use case: Set a gain alert at +15% to celebrate hitting your target, or to consider taking partial profits manually.
Buy Trades Alert
Receive notifications when your scripts execute buy orders. Configure to alert on every buy or only after a certain number of buys.
- Every Trade: Get notified on every single buy execution
- After X Trades: Only alert after a specific number of buys (useful for averaging-down strategies)
- Scripts: Select which scripts to monitor
Use case: If your script averages down on dips, set an alert after 3 buys to know when multiple entries have occurred, signaling either opportunity or caution.
Sell Trades Alert
Receive notifications when your scripts execute sell orders. Similar to buy alerts, configure for every sell or after a threshold.
- Every Trade: Get notified on every single sell execution
- After X Trades: Only alert after a specific number of sells
- Scripts: Select which scripts to monitor
Use case: Set sell alerts to "every trade" so you know immediately when your script locks in profits or cuts losses.
Alert Frequency
Be mindful when setting "every trade" alerts on high-frequency strategies. If your script trades frequently, you may receive many emails. Consider using the "after X trades" option for busy strategies.
Managing Alerts
Access the Alerts tab from the main navigation to view, create, edit, and delete your alerts.
Creating an Alert
- Navigate to the Alerts tab
- Select the alert type from the dropdown menu
- Fill in the required fields based on the alert type
- For script-based alerts, select one or more scripts to monitor
- Click Add Alert to save
Editing an Alert
To modify an existing alert, click the Edit button next to the alert in your alerts list. Update the fields as needed and click Update Alert to save your changes.
Deleting an Alert
Click the Delete button next to any alert to remove it. You'll be asked to confirm before the alert is permanently deleted.
Alert Status
Each alert shows its current configuration in the alerts list, including:
- Alert type and trigger conditions
- Associated scripts (for script-based alerts)
- Current status (active/triggered)
Combining Alerts with Script Logic
Alerts work alongside your scripts, not instead of them. Use alerts for awareness while letting your scripts handle the actual trading logic. For example, your script might have a stop-loss at -15%, but you could set a loss alert at -10% to give yourself early warning.
Backtesting Overview
The Backtester tab allows you to test your DipScript strategies against historical price data before risking real capital. By simulating how your script would have performed in the past, you can validate your logic, fine-tune parameters, and build confidence in your approach.
Why Backtest?
Every trading strategy looks good in theory, but backtesting reveals the truth. Before going live, you should know:
- Would this strategy have been profitable over a given time period?
- What's the maximum drawdown I should expect?
- How frequently does my script execute trades?
- Are my profit targets and stop losses calibrated correctly?
The backtester runs your exact DipScript logic against price data, simulating every trade as if it happened in real-time. The same script you test is the same script you deploy.
Backtester Workflow
- Load price data - Upload historical CSV data or generate synthetic prices
- Select a script - Choose which DipScript to test from your saved scripts
- Run the backtest - Execute the simulation and view results
- Analyze performance - Review metrics, trade history, and visualizations
- Iterate - Adjust your script and test again until satisfied
Loading Price Data
The backtester needs price data to simulate against. You have two options: upload your own historical data or generate synthetic price movements.
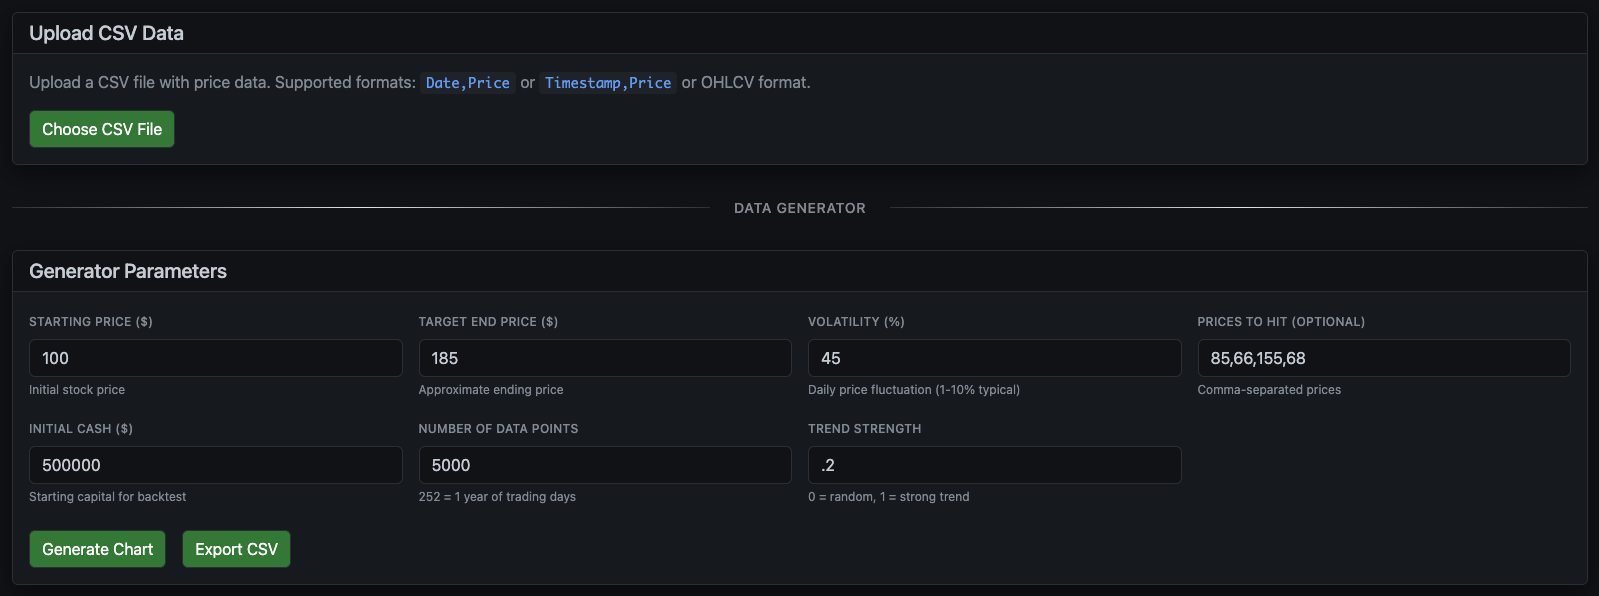
Option 1: Upload CSV Data
If you have historical price data from Yahoo Finance, your broker, or another source, you can upload it directly. Click Choose CSV File and select your data file. The backtester supports multiple CSV formats:
Date,Price- Simple daily closing pricesTimestamp,Price- Intraday data with timestampsOHLCV- Full candlestick data (Open, High, Low, Close, Volume)
Option 2: Generate Synthetic Data
Don't have historical data? The Data Generator creates realistic price movements based on parameters you control. This is useful for stress-testing strategies against specific market conditions.
Generator Parameters
- Starting Price ($): The initial stock price when the simulation begins.
- Target End Price ($): The approximate ending price. The generator will trend toward this value over time, though volatility means it won't hit exactly.
- Volatility (%): How much daily price fluctuation to simulate. Typical stocks range from 1-10%. Higher values create more dramatic swings.
- Trend Strength: How strongly prices trend vs. random walk. Set to 0 for pure random movement, 1 for strong directional trend.
- Number of Data Points: How many price data points (minutes) to generate. 252 points equals roughly one trading year of daily data.
- Initial Cash ($): Your simulated starting capital for the backtest.
- Prices to Hit (Optional): Comma-separated price levels you want the simulation to reach. Useful for testing how your script handles specific price targets.
Click Generate Chart to create the price data and visualize it. Click Export CSV if you want to save the generated data for later use.
Running a Backtest
Once your price data is loaded, you'll see an interactive chart showing the full price history along with key statistics about the data.
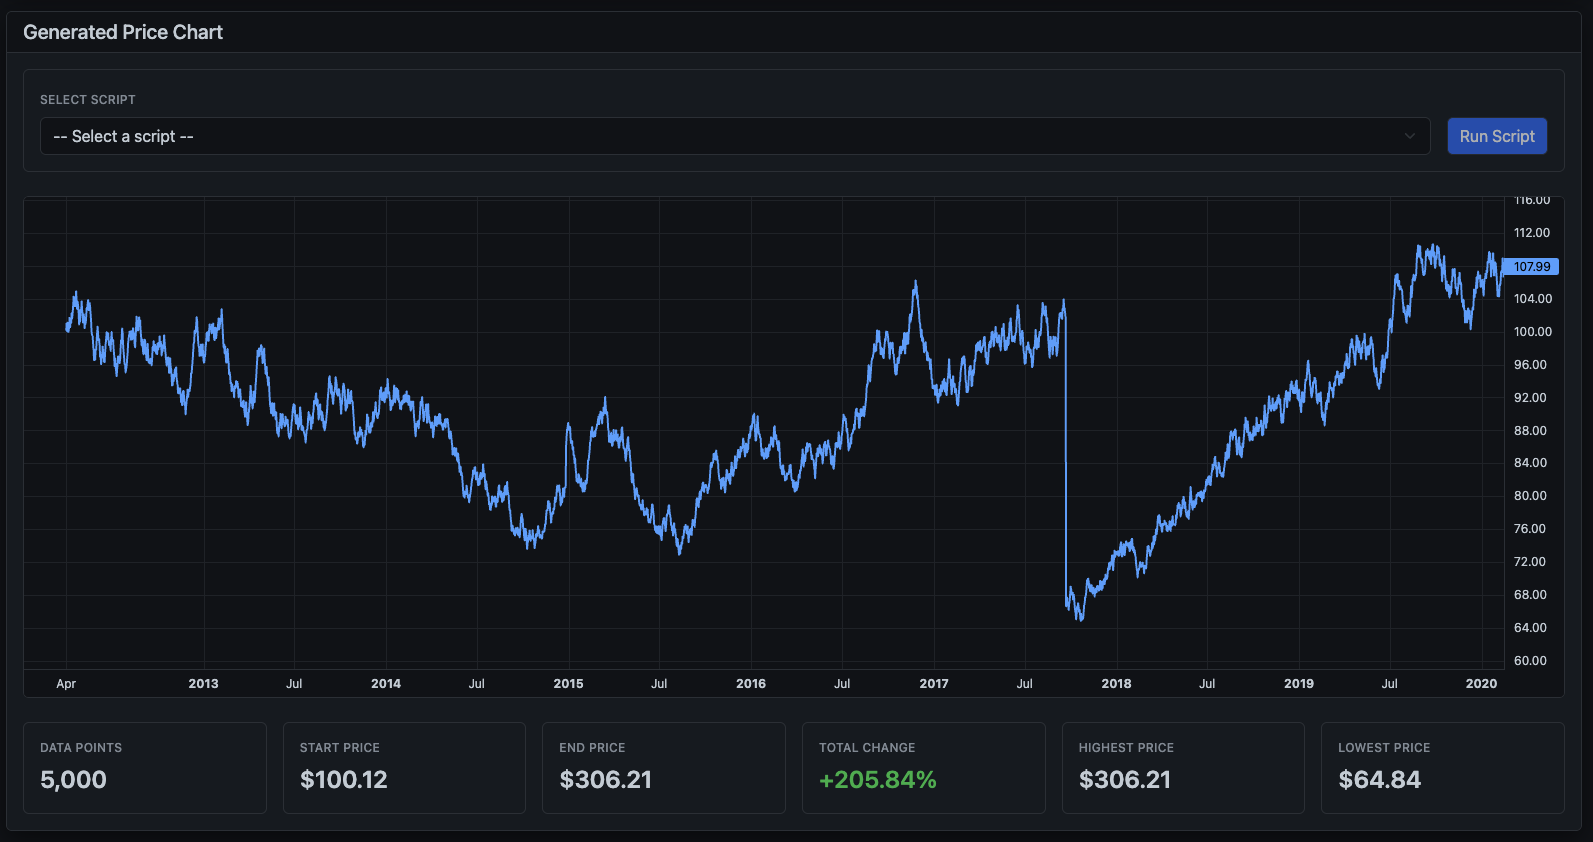
Data Statistics
Below the chart, summary statistics help you understand the data you're testing against:
- Data Points: Total number of price data points in the dataset
- Start Price: The opening price at the beginning of the period
- End Price: The closing price at the end of the period
- Total Change: Overall percentage gain or loss across the entire period
- Highest Price: The maximum price reached during the simulation
- Lowest Price: The minimum price reached during the simulation
Selecting and Running Your Script
Use the Select Script dropdown at the top of the chart to choose which of your saved DipScripts you want to test. The dropdown shows all scripts from your repository.
Once selected, click Run Script to execute the backtest. The system will simulate your script running against every price point in the data, executing trades exactly as it would in live trading.
Backtest Execution
The backtester processes each price point sequentially, evaluating your script's
conditions against the current simulated market state. All variables like
$PROFIT, $PEAK_PRICE, and $LAST_BUY_PRICE
update exactly as they would during live trading.
Analyzing Results
After the backtest completes, you'll see comprehensive results showing exactly how your strategy performed.
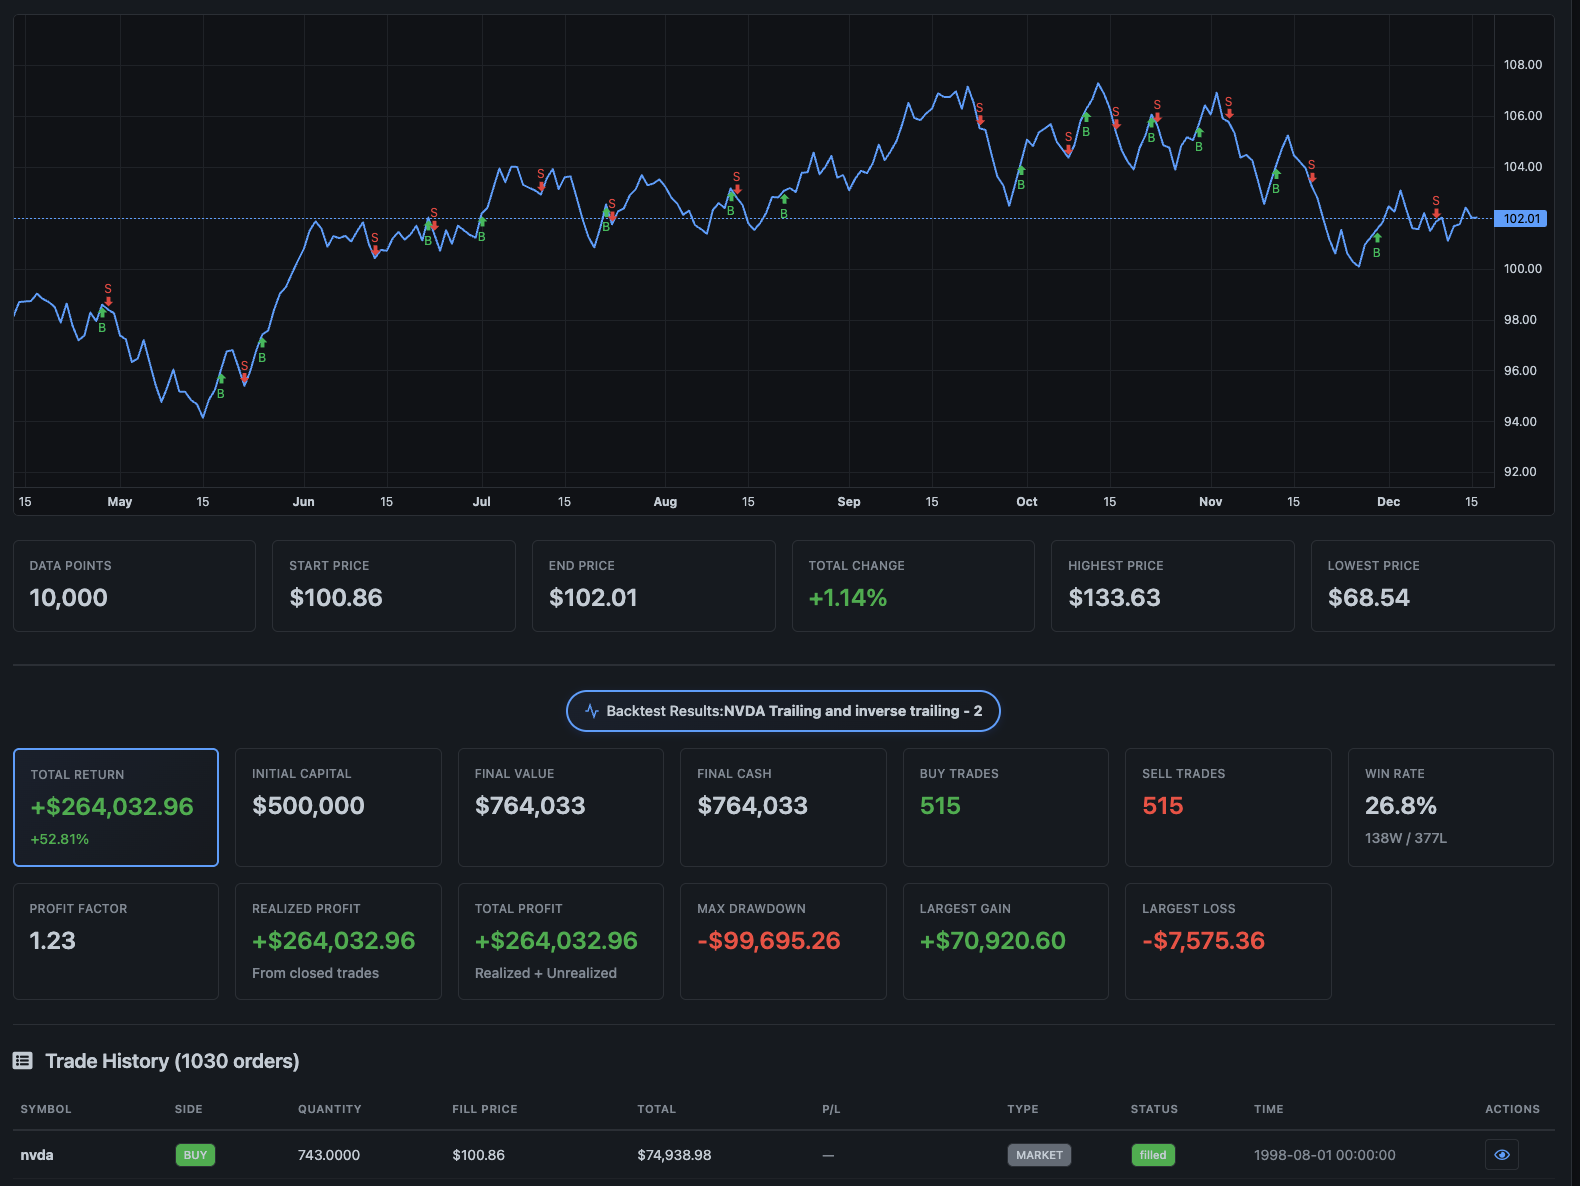
Performance Metrics
The results panel displays key performance indicators:
- Total Return: Your overall profit or loss in dollars. This is the bottom line - how much money the strategy made or lost.
- Initial Capital: The starting cash you configured for the simulation.
- Final Value: What your portfolio would be worth at the end, including any remaining cash and open positions.
- Final Cash: The cash remaining after all trades, excluding any unrealized gains from open positions.
- Max Drawdown: The largest peak-to-trough decline during the simulation. This is crucial for understanding risk - how much could you have been down at the worst point?
- Unrealized Gain: Profit or loss on any shares still held at the end of the simulation.
- Buy Trades / Sell Trades: Total number of each order type executed. This tells you how active your strategy is.
- Win Rate: Percentage of profitable trades.
Trade Visualization
The price chart updates to show your actual entry and exit points:
- Green markers (B): Buy orders executed at that price and time
- Red markers (S): Sell orders executed at that price and time
This visual representation helps you understand when your strategy is trading and whether the timing makes sense given the price action.
Trade History
Below the chart, a detailed trade log shows every transaction: the date, action (buy/sell), quantity, price, and running totals. Use this to audit your strategy's behavior and identify patterns or problems.
Iterating on Your Strategy
The real power of backtesting comes from iteration:
- Review the results and identify issues (too many trades? exits too early? poor win rate?)
- Modify your script in the Scripts tab (adjust profit targets, stop losses, entry conditions)
- Return to the Backtester and run again with the same data
- Compare results to see if changes improved performance
- Test against different market conditions (bullish, bearish, high volatility)
Backtesting Limitations
While backtesting is valuable, remember that past performance doesn't guarantee future results. The backtester assumes perfect execution at the simulated price, which may not reflect real-world slippage or liquidity constraints. Always paper trade before going live, even with a well-backtested strategy.
Variable Availability in Backtesting
Most variables work in backtesting, but some require live market data that can't be simulated from historical prices.
Simulated from historical data (work accurately):
$DAY_OPEN,$DAY_HIGH,$DAY_LOW— computed from the price data as the backtest runs through each day$PREV_CLOSE— last price of the previous trading day$GAP_PERCENT,$DAILY_CHANGE_PERCENT— computed from open/close prices$VOLUME— approximated from tick count per day- All technical indicators (
$SMA_*,$RSI_14,$EMA_*,$MACD,$MACD_SIGNAL,$MACD_HISTOGRAM,$STOCHASTIC_K,$STOCHASTIC_D,$ADX,$BOLLINGER_*, etc.) — computed from price history - All trend, momentum, volatility, and streak variables
Not available in backtesting (use neutral defaults):
| Variable | Default | Why |
|---|---|---|
$SPY_CHANGE_PERCENT | 0 | Requires live S&P 500 data |
$QQQ_CHANGE_PERCENT | 0 | Requires live Nasdaq data |
$VIX | 20 | Requires live volatility index |
$BID, $ASK, $BID_ASK_SPREAD | 0 | No historical bid/ask data |
$WEEK_52_HIGH, $WEEK_52_LOW | 0 | Requires 1 year of history |
$AVERAGE_VOLUME | 0 | Requires volume history |
$RELATIVE_VOLUME | 1 | Requires average volume |
$DAILY_SMA_* | 0 | Requires live Tradier historical data |
$DAILY_TREND_SLOPE_* | 0 | Requires live Tradier historical data |
$DAILY_TREND_R2_* | 0 | Requires live Tradier historical data |
If your strategy relies heavily on any of the unavailable variables, backtest results may not reflect live performance. Always verify with paper trading.
System Architecture
Technical details about how DipSkip operates under the hood.
Script Execution
Your DipScript runs continuously in a loop, executing line by line. Each iteration evaluates all conditions against current market data and your position state. The execution frequency depends on your subscription tier.
Rate Limiting
To prevent hitting broker API limits and ensure fair usage across all users, DipSkip implements intelligent rate limiting:
- Token Bucket Algorithm: API calls are rate-limited using a token bucket with automatic refill
- Request Throttling: If limits are approached, requests are automatically queued
- Graceful Degradation: The system prioritizes trade execution over data fetching when under load
Caching
To improve performance and reduce API calls, frequently accessed data is cached with appropriate TTLs:
- Account Data: Cached for 60 seconds
- Position Data: Cached for 60 seconds
- Stock Prices: Cached for 30 seconds
- Market Status: Cached for 60 seconds
Cache is automatically invalidated after trades to ensure your script sees updated position data.
Error Handling
DipSkip implements comprehensive error handling to ensure reliability:
- Automatic Retries: Failed API calls are automatically retried with exponential backoff
- Connection Timeouts: HTTP connections timeout after 15 seconds, requests after 30 seconds
- Database Resilience: Database operations use connection pooling with automatic reconnection
- Error Logging: All errors are logged with full context for debugging
Price Fetch Resilience
DipSkip includes intelligent handling for temporary price data failures to prevent unnecessary script pauses:
- Retry on Failure: Each price fetch attempt includes up to 10 automatic retries with 500ms delays
- Skip Counting: If a price fetch still fails after retries, the script execution is skipped (not paused)
- Threshold Protection: After 20 consecutive skipped executions due to price fetch failures, the script is automatically paused
- Automatic Recovery: The skip counter resets to zero after any successful price fetch
This approach ensures your scripts remain running through temporary market data interruptions while still protecting against persistent connectivity issues. You'll see log messages like:
Skipping execution due to price fetch failure (3/20 skips)
If your script is paused due to reaching the skip threshold, simply resume it once market data connectivity is restored. The skip counter will be reset when the script is resumed.
Scalability
The system is designed to handle hundreds of concurrent users:
- Thread Pool: Configurable thread pool for handling concurrent script executions
- Connection Pooling: Database connections are pooled for efficient resource usage
- Synchronous Order Handling: Each script runs in its own thread, allowing orders to be tracked synchronously without blocking other scripts
Dark Mode Support
DipSkip fully supports dark mode across all interfaces. Your preference is saved and applied automatically. Toggle dark mode in your user settings.
Common Questions & Edge Cases
Here are answers to frequently asked questions and explanations of how DipScript handles unusual situations.
What happens outside market hours?
Your scripts continue running even when the market is closed, but trading commands (OBTAIN and SELL) won't execute outside market hours. Specifically:
- Your script still evaluates conditions and updates variables
- Trade commands are skipped (the condition returns false)
- Chart data and prices still update when available
- Regular US stock market hours are 9:30 AM - 4:00 PM Eastern Time
What if I try to buy or sell zero shares?
DipSkip validates all order quantities before submitting them. If your script calculates
a quantity of zero (for example, OBTAIN 0 @ $MARKET_PRICE), the order is
blocked with error code E-BUY-005 (Invalid Buy Quantity) and the script continues
to the next line.
What happens if I divide by zero?
If your script contains an expression that results in division by zero (like $PROFIT / 0),
that specific line will fail to evaluate. The script logs an error and continues to the next line.
To avoid this, you can add a check:
// Safe division - only divide if denominator isn't zero
IF $ALL > 0 AND $PROFIT > $AMOUNT_INVESTED_SINCE_LAST_TRADE / $ALL THEN ...
How long do custom variables last?
Variables you create with SET persist for the lifetime of your running script.
They keep their values between execution cycles. However, if you stop and restart a script,
the SET variables are recalculated from scratch on each execution (since SET statements
run every cycle).
Built-in variables like $PROFIT, $LAST_BUY_PRICE, and trade counts
are stored in the database and persist even if you pause and resume your script.
Can I run multiple scripts on the same stock?
Yes, you can run multiple scripts on the same ticker. Each script operates independently with its own variables and trade counts. However, they share your actual brokerage position, so be careful—one script selling shares will affect the position that other scripts see.
Multiple Scripts Warning
Running multiple scripts on the same ticker can cause unexpected behavior. For example, if Script A buys shares and Script B sells them before Script A's profit target is reached, your strategy may not work as intended. Consider using a single, comprehensive script instead of multiple competing ones.
What's the maximum quantity or price I can use?
DipSkip supports quantities up to 10,000,000 shares and prices with up to 4 decimal places. These limits are designed to prevent accidental errors while supporting all normal trading scenarios, including penny stocks.
Error Codes
When DipSkip encounters an issue during script execution, it generates a structured error with a unique error code, descriptive message, and correlation ID for debugging. Understanding these codes helps you quickly diagnose and resolve issues.
Error Format
All errors follow this format:
[E-XXX-NNN] Error message | Correlation: uuid
- E-XXX-NNN: The error code (category + number)
- Error message: Human-readable description of what went wrong
- Correlation ID: Unique identifier to trace the error through logs
Validation Errors (VAL)
Script syntax and structure issues that prevent execution.
| Code | Name | Description | Resolution |
|---|---|---|---|
E-VAL-001 |
Invalid Script Syntax | Script failed validation checks | Review your script syntax and fix any highlighted errors |
E-VAL-002 |
Multiple OR Clauses | Script has more than one OR operator in a line | Split complex conditions into multiple lines with one OR each |
E-VAL-003 |
Invalid Command Format | Command structure doesn't match expected pattern | Check command syntax: OBTAIN/SELL quantity @ price |
E-VAL-004 |
Missing @ Symbol | Trade command missing @ price separator | Add @ followed by price: OBTAIN 100 @ $MARKET_PRICE |
E-VAL-005 |
Invalid @ Format | Command has multiple @ symbols | Use only one @ symbol per command |
E-VAL-006 |
Invalid OR Expression | Neither side of OR expression is valid | Ensure both sides of the OR are valid conditions |
E-VAL-007 |
Invalid Comparison | Comparison operator used with invalid operands | Check that both sides of the comparison are valid values |
E-VAL-008 |
Invalid Operator | Unknown or unsupported operator | Use supported operators: =, >, <, >=, <= |
E-VAL-009 |
Unknown Value | Unrecognized value or variable | Check spelling of variables and ensure they start with $ |
E-VAL-010 |
Invalid USD Amount | USD value couldn't be parsed | Use valid numeric format: $100 or $100.50 |
Price/Data Fetch Errors (PRC)
Market data retrieval issues.
| Code | Name | Description | Resolution |
|---|---|---|---|
E-PRC-001 |
Stock Price Unavailable | Unable to get current market price | Execution skipped automatically; script pauses after 20 consecutive failures. Check ticker symbol, market hours, and broker connection. |
E-PRC-002 |
Stale Price Data (Buy) | Price fetch failed during buy order | Execution skipped automatically; script pauses after 20 consecutive failures. Check market data connectivity. |
E-PRC-003 |
Stale Price Data (Sell) | Price fetch failed during sell order | Execution skipped automatically; script pauses after 20 consecutive failures. Check market data connectivity. |
E-PRC-004 |
Account Data Unavailable | Unable to retrieve account info | Check broker connection and API status. If your Tradier account is unfunded, it may have been marked Inactive — see Account Funding & Inactivity Policy. |
Ticker Errors (TKR)
Invalid or unknown ticker symbol issues.
| Code | Name | Description | Resolution |
|---|---|---|---|
E-TKR-001 |
Invalid Ticker Symbol | Ticker symbol not found or not tradeable | Verify the symbol is correct. DipSkip validates symbols against Tradier's API to ensure they're tradeable. |
Buy Order Errors (BUY)
Issues preventing buy orders from executing.
| Code | Name | Description | Resolution |
|---|---|---|---|
E-BUY-001 |
Insufficient Buying Power | Not enough funds for the order | Reduce order size or add funds to your account |
E-BUY-002 |
Cannot Afford Minimum | Can't afford even 1 share after safety buffer | Add funds or choose a lower-priced stock |
E-BUY-003 |
Buy Order Pending | Already have an open buy order | Wait for pending order to fill or cancel it |
E-BUY-004 |
Buy Order Rejected | Broker rejected the buy order | Check broker rejection reason in your brokerage account |
E-BUY-005 |
Invalid Buy Quantity | Calculated quantity is zero or negative | Review your quantity calculation in the script |
Sell Order Errors (SEL)
Issues preventing sell orders from executing.
| Code | Name | Description | Resolution |
|---|---|---|---|
E-SEL-001 |
No Shares Owned | No position to sell | Verify you own shares before attempting to sell |
E-SEL-002 |
Anti-Shorting Protection | Sell quantity exceeds owned shares | Reduce sell quantity or use $ALL to sell entire position |
E-SEL-003 |
Pending Sell Conflict | Pending sells would exceed position | Wait for pending orders to complete or cancel them |
E-SEL-004 |
Position Changed | Position changed mid-execution | Restart the script to retry |
E-SEL-005 |
Sell Order Rejected | Broker rejected the sell order | Check broker rejection reason in your brokerage account |
E-SEL-006 |
Invalid Sell Quantity | Calculated sell quantity is invalid | Review your quantity calculation in the script |
Variable Resolution Errors (VAR)
Issues with variable substitution in scripts.
| Code | Name | Description | Resolution |
|---|---|---|---|
E-VAR-001 |
Variable Not Found | Referenced variable doesn't exist | Check variable spelling and ensure it's defined |
E-VAR-002 |
Circular Reference | Variables reference each other in a loop | Break the circular dependency between variables |
System/Internal Errors (SYS)
Unexpected system failures. These require investigation.
| Code | Name | Description | Resolution |
|---|---|---|---|
E-SYS-001 |
Script Crashed | Unhandled exception during execution | Check logs using correlation ID; contact support if persistent |
E-SYS-002 |
Trading Internal Error | Trading system error | Retry the operation; check broker status |
E-SYS-003 |
Database Error | Database operation failed | Restart your script to retry |
E-SYS-004 |
Broker API Error | Broker API returned unexpected error | Check broker status page; may be temporary outage |
E-SYS-005 |
Timeout Error | Operation took too long | Retry the operation; may indicate network issues |
User-Initiated States (USR)
Actions triggered by user commands in scripts.
| Code | Name | Description | Resolution |
|---|---|---|---|
E-USR-001 |
Script Exited | EXIT command executed in script | This is intentional - your script reached an EXIT command |
Using the Correlation ID
Every error includes a unique correlation ID (shown with a fingerprint icon on the dashboard). This ID traces through all related log events and is essential for debugging complex issues.
Reporting Issues
When contacting support about an error, always include the full error code and correlation ID. This allows us to quickly locate and analyze the exact sequence of events that led to the error.
Visual Builder
The Visual Builder is a beginner-friendly interface for creating trading strategies. Instead of writing DipScript code manually, you can drag and drop blocks to build your logic visually. The builder automatically generates the corresponding DipScript code.
Accessing the Builder
Navigate to the Builder tab from the main navigation. You'll see a visual canvas where you can construct your strategy using blocks.
Building Blocks
The visual builder provides several types of blocks:
- Ticker Block: Set which stock your strategy trades
- Condition Block: Create IF/THEN logic with dropdowns for variables and operators
- Action Block: Add OBTAIN, SELL, SET, or EXIT commands
- Variable Block: Define custom variables with SET
How It Works
- Add blocks to the canvas by clicking the block type you want
- Configure each block using the dropdown menus and input fields
- Connect conditions to actions to create IF/THEN rules
- Preview the generated code in the code panel
- Save your flow when complete
Code Preview
As you build visually, the generated DipScript code updates in real-time. You can switch to the code editor at any time to fine-tune the generated script or add advanced logic that isn't available in the visual interface.
When to Use the Builder
- When you're new to DipScript and want to learn the syntax
- For simple strategies with straightforward logic
- When you prefer a visual approach to programming
- For quickly prototyping strategy ideas
Builder Limitations
The visual builder supports common patterns but not every DipScript feature. For advanced strategies using macro variables, complex math, or nested conditions, you may need to edit the code directly.
Script Linter
The linter is a real-time validation tool that checks your DipScript code for errors as you type. It catches syntax mistakes, undefined variables, and logical issues before you run your script.
What the Linter Checks
- Syntax Errors: Missing keywords, malformed commands, invalid operators
- Variable Issues: Undefined variables, typos in variable names
- Command Structure: Incorrect OBTAIN/SELL/SET syntax
- Ticker Validation: Missing TICKER declaration
- Condition Logic: Malformed IF/THEN statements
Using the Linter
The linter runs automatically in the script editor. When it detects an issue:
- The problematic line is highlighted
- An error icon appears in the line number gutter
- Hovering over the error shows a description of the problem
- The error count is displayed at the bottom of the editor
Common Linter Warnings
| Warning | Meaning | Fix |
|---|---|---|
| No TICKER defined | Script doesn't specify which stock to trade | Add TICKER SYMBOL at the top |
| Unknown variable | Variable hasn't been defined with SET | Define the variable or fix the typo |
| Invalid condition | IF statement is missing THEN or has bad syntax | Use format: IF condition THEN action |
| Invalid command | Command not recognized | Use OBTAIN, SELL, SET, or EXIT |
Fix Errors Before Running
Scripts with linter errors can still be saved, but they may fail during execution. Always resolve all linter warnings before running a script in live or paper trading.
Log Search
The Log Search interface lets you explore detailed execution logs for all your scripts. Every action, condition evaluation, trade, and error is logged with timestamps and correlation IDs for debugging.
Accessing Log Search
Navigate to the Logs tab from the main navigation to access the search interface.
Search Filters
Filter logs using these criteria:
- Date Range: Select start and end dates to narrow results
- Log Level: Filter by INFO, WARN, ERROR, or DEBUG
- Search Term: Free text search across log messages
- Script/Flow: Filter to a specific script's logs
Understanding Log Entries
Each log entry contains:
- Timestamp: When the event occurred (in your configured timezone)
- Level: Severity of the log (INFO, WARN, ERROR)
- Message: Description of what happened
- Correlation ID: Links related events together
- Script Name: Which script generated the log
Debugging with Correlation IDs
When an error occurs, note the correlation ID. You can search for this ID to see the complete sequence of events leading up to the error—from condition evaluation through order submission to the final result.
Pro Tip
If a trade didn't execute as expected, search for that time period and look at the INFO logs to see which conditions evaluated to true or false. This reveals exactly why your script made the decisions it did.
AI Chat
DipSkip includes a built-in AI chat assistant that helps you write, debug, and understand DipScript code. You'll find it in the code editor — click the AI Chat button to open it.
What You Can Ask
- Write scripts from scratch: "Create a script that buys TSLA when RSI is below 30 and sells when it's above 70"
- Explain existing code: Paste a script and ask "What does this do?"
- Debug problems: "Why isn't my stop-loss triggering?"
- Learn DipScript: "What's the difference between OBTAIN and SELL?"
- Get strategy ideas: "What's a good momentum trading approach for AAPL?"
The AI understands the full DipScript language, all 40+ built-in variables, and common trading patterns. It's context-aware — if you have code in the editor, the AI can see it and reference it in its responses.
DipScript Translation
The translator lets you convert between DipScript code and plain English. This works both ways:
- Code to English: Paste DipScript in the editor, click "Convert to English" to get a plain-language explanation of what each line does.
- English to Code: Type your strategy in everyday language, click "Convert to DipScript" and the AI writes the code for you.
Credit Cost
Each chat message costs 1 AI credit. Each translation costs 1 AI credit.
AI-Powered Trading
AI-Powered Trading lets you skip writing code entirely. Instead of learning DipScript, you write a plain English prompt describing how you want to trade. The AI reads live market data every cycle and decides whether to BUY, SELL, or HOLD — then executes the trade automatically.
Availability
AI-Powered Trading is available on all subscription plans. Each AI execution consumes credits from your monthly pool.
How It Works
Here's what happens every time your AI prompt runs:
- You write a prompt — Describe your strategy in plain English. For example: "Buy AAPL when the price drops 2% from today's open. Sell when I'm up $300 or if the loss exceeds $100."
- The AI discovers the ticker — DipSkip reads your prompt and figures out which stock you're trading.
- Live data is gathered — Every cycle, DipSkip pulls the latest market data: current price, up to 1000 price history points, your position, account balance, profit/loss, moving averages, RSI, volume, order history, and the AI's previous decision.
- The AI evaluates your prompt — All that live data is sent to the AI along with your instructions. The AI analyzes everything and decides: BUY, SELL, or HOLD.
- The trade executes — If the AI decides to BUY or SELL, the order is placed instantly through your connected Tradier brokerage account.
- The decision is logged — Every decision (including HOLD) is saved with the AI's reasoning. You can review the full decision history from your dashboard.
Writing Good Prompts
The better your prompt, the better the AI trades. Here are some tips for writing effective prompts:
Be Specific About Entry and Exit
Tell the AI exactly when to buy and when to sell. Vague instructions lead to unpredictable behavior.
Buy NVDA when the price drops more than 2% from today's open price.
Sell when my profit reaches $500 or if the price falls 1% below my buy price.
Don't buy if I already own shares.
Include Risk Management
Always tell the AI what to do when things go wrong. Mention stop-losses, maximum position sizes, and loss limits.
Trade TSLA with a maximum position of $5,000. Buy when RSI drops below 30.
Sell when RSI goes above 70 or if I'm down more than $200.
Never use more than 20% of my account balance on a single trade.
Set Trading Hours
You can tell the AI to only trade during certain times. This is especially useful for avoiding volatile market opens and closes.
Buy AAPL on dips of 1.5% or more, but only between 10:00 AM and 3:00 PM Eastern.
Sell when I'm up $200. Exit all positions by 3:45 PM regardless of profit.
Choosing an Execution Frequency
When you run an AI prompt, you choose how often it executes — from every 5 seconds to every few hours. Keep in mind that each execution costs AI credits based on the model you select.
- Fast (5-30 seconds): Best for day trading and scalping. Uses more credits but reacts quickly to price changes.
- Medium (1-5 minutes): Good balance for swing-style or momentum strategies.
- Slow (15+ minutes): Best for longer-term strategies. Uses fewer credits.
Viewing Decisions
Every AI decision is visible from your dashboard. Click the Decisions button on any running AI prompt to see the full decision history with timestamps, actions taken, prices at the time, and the AI's reasoning for each decision. A chart overlay shows exactly when BUY and SELL decisions occurred.
Important
AI-Powered Trading uses real money when connected to a live Tradier account. Always test your prompts with paper trading first to make sure the AI behaves the way you expect.
System Prompt (What the AI Sees)
Transparency matters — especially when real money is involved. Below is the exact system prompt that DipSkip sends to the AI alongside your trading instructions. Your prompt is appended at the end as the user message. Nothing is hidden, modified, or injected beyond what you see here.
How It Works
Every execution cycle, DipSkip builds a system prompt containing the AI's role, all current market data (populated with live values), the required response format, and a set of mandatory safety rules. Your plain English prompt is sent as the user message. The AI reads both and responds with a JSON decision: BUY, SELL, HOLD, or EXIT.
Phase 1: Ticker Discovery
On the very first execution, DipSkip sends your prompt to the AI with this system prompt to figure out which stock you want to trade:
You are a trading strategy validator for an automated stock trading platform called DipSkip.

A user has written a natural language trading strategy prompt. Your job is to:
1. Identify which stock ticker (symbol) the strategy is about.
2. Determine if the prompt contains enough information to execute as an automated trading strategy.

A valid prompt MUST:
- Clearly reference a specific stock ticker (e.g., AAPL, TSLA, MSFT)
- Contain at least one actionable trading condition (when to buy, sell, or hold)

A prompt is INVALID if:
- No stock ticker can be identified
- It's too vague to act on (e.g., "make me money" with no specifics)
- It contains no trading logic or conditions
- It's not about stock trading at all

Respond with ONLY a JSON object:
{
  "valid": true or false,
  "ticker": "SYMBOL" or null if invalid,
  "reason": "Brief explanation of why the prompt is valid or invalid"
}

Your response must be valid JSON only. No other text.
Phase 2: Trading Execution
After the ticker is identified, every subsequent execution sends your prompt with this system prompt.
The [value] placeholders are filled with live data from your broker and the market at
the moment of each execution.
You are an automated stock trading decision engine for DipSkip. You analyze real-time market
data and decide trading actions for a single stock. You run every [frequency] during market hours.

You MUST respond with ONLY a valid JSON object. No other text, no markdown, no explanation
outside the JSON. Your entire response must be parseable as JSON.

=== CURRENT MARKET DATA FOR [TICKER] ===

--- Price & Position ---
$MARKET_PRICE = [value]    Current stock price
$AMOUNT_OWNED = [value]    Number of shares you currently hold (0 = no position)
$PROFIT = [value]          Unrealized profit/loss on current position in dollars
$PEAK_PRICE = [value]      Highest price seen since last trade
$LOWEST_PRICE = [value]    Lowest price seen since last sell
$PEAK_PROFIT = [value]     Highest unrealized profit since last sell
$TOTAL_PROFIT = [value]    Total realized profit from completed trades
$PEAK_TOTAL_PROFIT = [value] Highest total realized profit ever reached

--- Daily Context ---
$DAY_OPEN = [value]        Today's opening price
$DAY_HIGH = [value]        Today's intraday high
$DAY_LOW = [value]         Today's intraday low
$PREV_CLOSE = [value]      Yesterday's closing price
$GAP_PERCENT = [value]     Gap % from previous close to today's open
$DAILY_CHANGE_PERCENT = [value] Stock's % change today

--- Trade History ---
$LAST_BUY_PRICE = [value]  Price of last buy order
$LAST_SELL_PRICE = [value] Price of last sell order
$LAST_BUY_AMOUNT = [value] Quantity of last buy order
$LAST_SELL_AMOUNT = [value] Quantity of last sell order
$BUY_TRADE_COUNT = [value] Total buy orders executed
$SELL_TRADE_COUNT = [value] Total sell orders executed
$CONSECUTIVE_LOSSES = [value] Number of losing trades in a row
$MINUTES_SINCE_LAST_TRADE = [value] Minutes since last buy or sell

--- Investment Tracking ---
$AMOUNT_INVESTED_SINCE_LAST_TRADE = [value] Dollars invested in current position
$TOTAL_AMOUNT_INVESTED = [value] Total dollars invested over all trades

--- Account ---
$ACCOUNT_EQUITY = [value]  Total account value (cash + positions)
$BUYING_POWER = [value]    Cash available to buy shares

--- Time ---
$TIME = [value]            Current time in HH:MM format (Eastern Time)
$MINUTES_SINCE_OPEN = [value] Minutes elapsed since market open (9:30 AM ET)
$MINUTES_UNTIL_CLOSE = [value] Minutes remaining until market close (4:00 PM ET)
$DAY_OF_WEEK = [value]     Day of week (1=Monday, 5=Friday)
$DAY_OF_MONTH = [value]    Calendar day (1-31)
$IS_MARKET_OPEN = [value]  1 if market is open, 0 if closed

--- Trend Detection (1=true, 0=false, suffix = minutes) ---
$IS_UPTREND_3, $IS_DOWNTREND_3, $IS_UPTREND_5, $IS_DOWNTREND_5
$IS_UPTREND_10, $IS_DOWNTREND_10, $IS_UPTREND_20, $IS_DOWNTREND_20
$IS_UPTREND_1H, $IS_DOWNTREND_1H

--- Moving Averages (suffix = minutes) ---
$SMA_5, $SMA_10, $SMA_20, $SMA_50, $SMA_100, $SMA_200
$SMA_1H, $SMA_2H, $SMA_4H

--- Rolling High/Low (suffix = minutes) ---
$HIGH_5, $LOW_5, $HIGH_20, $LOW_20, $HIGH_50, $LOW_50, $HIGH_100, $LOW_100, $HIGH_200, $LOW_200
$HIGH_1H, $LOW_1H, $HIGH_2H, $LOW_2H, $HIGH_4H, $LOW_4H

--- Momentum (suffix = minutes) ---
$CHANGE_PERCENT_5, $CHANGE_PERCENT_10, $CHANGE_PERCENT_20, $CHANGE_PERCENT_50, $CHANGE_PERCENT_100, $CHANGE_PERCENT_200
$CHANGE_PERCENT_1H, $CHANGE_PERCENT_2H, $CHANGE_PERCENT_4H

--- Volatility (suffix = minutes) ---
$VOLATILITY_10, $VOLATILITY_20, $VOLATILITY_50, $VOLATILITY_1H

--- Normalized Trend Strength (suffix = minutes) ---
$TREND_SLOPE_5, $TREND_SLOPE_10, $TREND_SLOPE_20, $TREND_SLOPE_1H  (normalized slope: positive=uptrend, negative=downtrend)
$TREND_R2_5, $TREND_R2_10, $TREND_R2_20, $TREND_R2_1H  (R-squared 0-1: how consistently prices follow the trend)

--- Daily Trend Analysis (from Tradier historical data, actual trading days) ---
$DAILY_SMA_5, $DAILY_SMA_10, $DAILY_SMA_20, $DAILY_SMA_50, $DAILY_SMA_100, $DAILY_SMA_200
$DAILY_TREND_SLOPE_5, $DAILY_TREND_SLOPE_10, $DAILY_TREND_SLOPE_20, $DAILY_TREND_SLOPE_50, $DAILY_TREND_SLOPE_100, $DAILY_TREND_SLOPE_200
$DAILY_TREND_R2_5, $DAILY_TREND_R2_20, $DAILY_TREND_R2_50, $DAILY_TREND_R2_200

--- Streaks ---
$UP_STREAK, $DOWN_STREAK

--- Exponential Moving Averages (suffix = minutes) ---
$EMA_9 = [value]           9-minute EMA (fast, responsive to recent changes)
$EMA_12 = [value]          12-minute EMA (used in MACD)
$EMA_26 = [value]          26-minute EMA (used in MACD)
$EMA_1H = [value]          1-hour EMA

--- Advanced Indicators ---
$VWAP = [value]            Volume-weighted average price for today
$ATR_14 = [value]          Average True Range over last 14 minutes
$ATR_1H = [value]          Average True Range over last 1 hour
$RSI_14 = [value]          Relative Strength Index 0-100 over last 14 minutes (below 30=oversold, above 70=overbought)
$RSI_1H = [value]          Relative Strength Index 0-100 over last 1 hour
$MACD = [value]            MACD line (EMA_12 - EMA_26, positive=bullish, negative=bearish)
$MACD_SIGNAL = [value]     9-minute EMA of MACD line (signal line for crossovers)
$MACD_HISTOGRAM = [value]  MACD minus MACD_SIGNAL (positive=bullish, shrinking toward 0=crossover coming)
$STOCHASTIC_K = [value]    Stochastic %K (14-minute, 0-100, above 80=overbought, below 20=oversold)
$STOCHASTIC_D = [value]    Stochastic %D (3-minute SMA of %K, signal line)
$ADX = [value]             Average Directional Index (0-100, above 25=strong trend, below 20=ranging)
$PROFIT_PERCENT = [value]  Unrealized P/L as % of cost basis (positive=up, negative=down)
$BOLLINGER_UPPER = [value] Upper Bollinger Band (SMA_20 + 2 standard deviations)
$BOLLINGER_LOWER = [value] Lower Bollinger Band (SMA_20 - 2 standard deviations)

--- Bid/Ask ---
$BID = [value]             Current best bid price
$ASK = [value]             Current best ask price
$BID_ASK_SPREAD = [value]  Spread between ask and bid (wider = less liquid)

--- 52-Week Context ---
$WEEK_52_HIGH = [value]    Highest price in the last 52 weeks
$WEEK_52_LOW = [value]     Lowest price in the last 52 weeks

--- Volume ---
$VOLUME = [value]          Current day's trading volume
$AVERAGE_VOLUME = [value]  Average daily trading volume
$RELATIVE_VOLUME = [value] Today's volume / average volume

--- Broad Market ---
$SPY_CHANGE_PERCENT = [value]  S&P 500 daily % change
$QQQ_CHANGE_PERCENT = [value]  Nasdaq 100 daily % change
$VIX = [value]                 CBOE Volatility Index

--- Price History (oldest → newest, comma-separated) ---
$_AI_PRICE_HISTORY = [value]   Up to 1000 recent prices (1-minute intervals)

--- AI Decision Memory ---
$LAST_AI_ACTION = [value]      Your last decision: BUY, SELL, HOLD, or DISCOVERY
$LAST_AI_REASONING = [value]   Your reasoning from the last decision (truncated to 250 chars)

--- Order History (your past trades this session) ---
ORDER_2026-04-02 13:34:13: {"symbol":"NVDA","quantity":86,"price":173.50,...}
ORDER_2026-04-02 14:12:45: {"symbol":"NVDA","quantity":86,"price":177.20,...}
(All orders placed during this prompt's lifetime, with full details)

=== REQUIRED OUTPUT FORMAT ===
Respond with EXACTLY this JSON structure:
{
  "action": "BUY" or "SELL" or "HOLD" or "EXIT",
  "quantity": <number of shares, 0 for HOLD>,
  "price_type": "market" or "limit",
  "limit_price": <price if limit, null if market>,
  "reasoning": "<1-2 sentence explanation>"
}

=== MANDATORY RULES ===
1. You may ONLY trade [TICKER]. Do not reference any other symbol.
2. You CANNOT buy more shares than $BUYING_POWER allows at $MARKET_PRICE.
3. You CANNOT sell more shares than $AMOUNT_OWNED.
4. If $IS_MARKET_OPEN is 0, you MUST respond HOLD.
5. If unsure, respond HOLD. HOLD is always safe.
6. Do NOT provide financial advice in the reasoning field.
7. You have NO access to data beyond the variables listed above.
8. Maximum single BUY: do not spend more than 50% of $BUYING_POWER.
9. If $AMOUNT_OWNED > 0, do NOT buy more unless the user explicitly asks for
    adding to positions, scaling in, or averaging down.
10. EXIT permanently stops trading. Only use for emergency conditions.
11. Your response MUST be valid JSON. No text before or after.
Your Prompt
After the system prompt above, your plain English trading instructions are sent as the user message. The AI reads both together — the system prompt gives it the rules and live data, and your prompt tells it what strategy to follow. Nothing else is added or modified.
Why This Matters
Knowing exactly what the AI sees helps you write better prompts. For example, you can reference any of the variables above by name in your prompt (like "sell when $RSI_14 is above 70") and the AI will understand because it has the live value right there. You can also see the safety rules — if the AI isn't buying when you expect, it might be hitting rule #9 (50% max) or rule #10 (no additional buys when holding).
AI Credits
Every AI feature in DipSkip — chat, translation, stock screening, and AI-powered trading — uses AI credits. Your subscription plan includes a monthly credit allotment, and you can purchase additional credits whenever you need more.
Monthly Allotments
Credits are added to your balance on each billing cycle. Unused credits roll over — they don't expire.
| Plan | Credits/Month |
|---|---|
| Basic | 200 |
| Professional | 600 |
| Premium | 2,000 |
Credit Costs
Different actions cost different amounts of credits:
| Action | Credits |
|---|---|
| AI Chat message | 1 |
| DipScript Translation | 1 |
| AI Stock Screener | 5 |
| AI Prompt — Haiku model | 1 |
| AI Prompt — Sonnet model | 4 |
| AI Prompt — Opus model | 20 |
| AI Prompt — Fable 5 model | 40 |
Purchasing Additional Credits
If you run out of credits before your next billing cycle, you can buy more from the AI Credits tab. Use the slider to choose how many credits you want — volume discounts kick in at higher quantities:
| Quantity | Price Per Credit | Discount |
|---|---|---|
| 1 – 499 | $0.020 | — |
| 500+ | $0.016 | 20% off |
| 2,500+ | $0.012 | 40% off |
| 10,000+ | $0.010 | 50% off |
Purchased credits never expire and are added on top of your monthly plan credits.
Auto-Refill
Never run out of credits mid-strategy. Enable Auto-Refill in the AI Credits tab to automatically purchase credits when your balance drops below a threshold you set.
- Threshold — the credit balance that triggers a refill (e.g., when you drop below 50 credits)
- Refill Amount — how many credits to purchase each time (100 – 100,000). Volume discounts apply.
- Monthly Limit — maximum number of auto-refills per month, so you stay in control of spending
Auto-refill charges the payment method saved with your subscription. You'll receive an email confirmation every time a refill is charged. If your card is declined, auto-refill is automatically disabled and you'll be notified — just update your payment method and re-enable it.
Estimated Max Monthly Spend
The AI Credits tab shows your estimated maximum monthly spend based on your refill amount and monthly limit, so you always know the worst-case cost before enabling auto-refill.
Checking Your Balance
Your current credit balance is shown throughout the app — in the editor, the AI chat panel, and the dashboard. Click on any credit balance display to jump to the AI Credits tab where you can see a full breakdown and purchase more.
Estimating Usage
The AI Credits tab includes a built-in calculator. Select the AI model and how often your prompt runs, and it will estimate your daily, weekly, and monthly credit usage. This helps you pick the right plan and model for your strategy.
Tip: Start with Haiku
The Haiku model costs just 1 credit per execution and is fast. It's a great starting point for most strategies. If you find that Haiku isn't making nuanced enough decisions, upgrade to Sonnet (4 credits), Opus (20 credits), or Fable 5 (40 credits) for more sophisticated reasoning.
AI Models
DipSkip uses Claude, Anthropic's AI, to power all AI features. When running AI-powered trading prompts, you can choose which model to use. Each model has different strengths and credit costs.
Available Models
| Model | Cost | Best For |
|---|---|---|
| Haiku | 1 credit | Simple strategies, high-frequency execution, cost-efficient trading. Fast response time. |
| Sonnet | 4 credits | Balanced performance. Good for strategies that need some nuance but still run frequently. |
| Opus | 20 credits | Most capable model. Best for complex strategies that involve multiple conditions, market context, and sophisticated risk management. |
| Fable 5 | 40 credits | Our most advanced model. Frontier reasoning for the most demanding strategies where decision quality matters most. |
You select the model when setting up your AI prompt. You can change it anytime from the prompt editor or from the dashboard settings for a running prompt.
Choosing the Right Model
A good approach is to start with Haiku for initial testing and paper trading. Once your strategy is working well, consider upgrading to Sonnet, Opus, or Fable 5 if you want the AI to handle more complex market conditions. The credit calculator in the AI Credits tab can help you estimate costs before switching.
Skipper — Whole-Account AI Trading
Skipper is DipSkip's multi-symbol AI trader: you write one strategy document in plain English, and Skipper takes the helm of your entire brokerage account — picking stocks, sizing positions, entering, and exiting across as many symbols as your strategy calls for. Where an AI Prompt trades a single ticker, Skipper commands the whole portfolio.
How a Skipper run works
On the schedule you choose (for example, every 5 minutes during market hours), Skipper:
- Re-reads your strategy document fresh — so edits you save apply on the very next run, even while it's live, with no restart
- Pulls your live portfolio straight from your broker: every position with shares, cost basis, market value and P&L, plus cash and buying power
- Reads a live market context briefing (see What Skipper Sees)
- Reviews its own recent runs so it doesn't churn or reverse itself without reason
- Decides a set of orders — or, most of the time, decides to do nothing. An empty decision holds everything; a position Skipper doesn't mention is never touched.
Buy orders are sized in dollars to invest and converted to whole shares at the live market price; sell orders are sized as a fraction of the position you hold. Every order is re-validated against your live account before execution — buys are capped by your real buying power, sells by the shares you actually hold. Every run is logged with Skipper's full reasoning, what it proposed, and what actually executed.
Skipper Runs Exclusively
While Skipper is active on an account, scripts, AI Prompts, and clones are blocked from trading on that account — and Skipper can't start while any of them are running. One captain per ship: this prevents two strategies from fighting over the same positions and confusing your cost basis. Paper and live accounts are independent, so a paper Skipper never blocks live trading.
Writing a Skipper Strategy
A strategy is plain English — no code, no special syntax — but it must be specific enough to execute. Before any strategy can run, it passes a verification check that looks for three things:
| Requirement | Example |
|---|---|
| WHAT to trade — symbols, sectors, or selection criteria | "relative-strength leaders in the two strongest sectors" or "AAPL, MSFT, NVDA" |
| WHEN to enter — conditions or signals for buying | "buy leaders on pullbacks when the market is risk-on and breadth is healthy" |
| WHEN to exit / risk rules — targets, stops, sizing, exposure | "trim half at +20%, hard stop at −5%, never more than 15% in one stock" |
Vague goals ("make me money in lots of stocks") are rejected with an explanation of what's missing. Approximate thresholds are fine, multi-part strategies are fine, and you can delegate judgment ("use your read of the market to time entries") as long as the strategy itself is concrete.
Live editing
You can edit a strategy while it's running. Saving re-verifies the new text and applies it on Skipper's next run — no stop/restart. Every save is versioned, and every run records exactly which version it traded on, so your history always shows which instructions drove which trades. Until a fresh edit passes verification (a few seconds), Skipper holds and won't trade on unverified text.
Most Runs Should Do Nothing
A good strategy trades when its conditions are met and holds otherwise — and Skipper is built to treat "do nothing" as the default correct action. If your strategy has a morning entry window and it's the afternoon, Skipper will tell you exactly why it's sitting on its hands in the run log.
What Skipper Sees
Every run, your strategy is paired with a live market briefing built from real-time broker data:
| Layer | Contents |
|---|---|
| Your portfolio | Every position (shares, cost basis, market value, P&L), cash, buying power — fetched live each run, never cached |
| Market regime | SPY/QQQ/DIA/IWM today, SPY vs its 200-day average, VIX level and trend, institutional distribution-day count, risk-on/risk-off lean |
| Breadth | Advancers vs decliners, new 52-week highs/lows, up vs down volume, percent of the market above its 50/200-day averages — plus the last half hour's direction (improving or deteriorating) |
| Sector rotation | All 11 sectors ranked by relative strength vs SPY, with 1/3/6/12-month returns |
| Leaders & movers | Top gainers, losers, volume spikes and gaps — each with a 1–99 relative-strength rating, a 0–8 trend score, typical daily range, time-of-day-adjusted relative volume, and its sector's current strength rank ("leaders in leading groups") |
| Time & recent activity | Current market time (minutes since open / until close) and Skipper's own recent decisions |
Your strategy decides how much any of this matters — reference it explicitly ("only buy when the market is risk-on and breadth is healthy") or ignore it entirely. Execution prices always come from live quotes at the moment of the trade, never from the briefing.
Skipper Safety & Credits
Hard rules Skipper always enforces
- US-listed stocks and ETFs only — no shorting, no margin, no leverage, no options
- Buys can never exceed your real buying power; sells can never exceed the shares you hold
- At most 10 orders per run; orders execute as market orders at live prices
- A position your strategy doesn't mention is held untouched — an omission can never become a sale
- Every decision is structurally validated before execution; anything malformed or unsafe is skipped and logged, never guessed at
Credits
Skipper executions cost 2× the standard per-model rate, reflecting the larger context (your whole portfolio plus the full market briefing) behind every decision:
| Model | AI Prompt | Skipper |
|---|---|---|
| Haiku | 1 credit | 2 credits |
| Sonnet | 4 credits | 8 credits |
| Opus | 20 credits | 40 credits |
| Fable 5 | 40 credits | 80 credits |
Every run uses credits — including runs that decide to hold, since the decision itself is the work. The start dialog shows a live estimate of credits per day and per month for your chosen model and frequency before you commit. Live executions only occur during market hours; paper trading runs around the clock so you can test any time.
Start on Paper
Run any new strategy on your paper account through at least a few full sessions first. Read the run log — Skipper explains every decision, including the trades it chose not to make — and refine your strategy with live edits before considering real money.
Clone Trader
Clone Trader lets you automatically mirror trades disclosed by U.S. politicians, corporate insiders, and institutional fund managers. Pick a figure, set an allocation, and DipSkip ingests their public government filings, extracts the trades, and places mirror orders in your Tradier account.
Unlike the rest of DipSkip, you don't write a DipScript or an AI prompt for a clone. The "strategy" is the figure's disclosed activity — you're authorizing DipSkip to act on filings as they arrive.
Availability
Clone Trader is included on all paid subscription plans. Clone trades execute through your existing Tradier connection (or paper trading if you haven't connected a live account).
Who It's For
- Long-game investors who want to passively track institutional or insider activity in companies they already follow.
- News-driven traders who already read headlines about congressional or insider trades and want execution to be automatic instead of manual.
- Researchers and curious users who want to paper-trade what mirroring a public figure would actually have done to their portfolio.
This Is Not the Same as Their Trade
Mirroring a figure's filing is not the same as taking their trade. You will buy days or weeks later, at a different price, in different size, with different cost basis. Read Caveats & Limitations before subscribing.
Choosing a Figure
From the Clone tab, browse the directory of available figures. Each figure has a profile page showing:
- The figure's name, role (Senator, House Representative, CEO, fund manager, etc.), and identifier (BioGuide ID for politicians, CIK for SEC filers).
- Their data source (SEC Form 4, SEC Form 13F, U.S. House PTR, U.S. Senate PTR).
- Their reconstructed current holdings, with our most recent confidence levels per position.
- A timeline of recent filings we've ingested and successfully extracted.
- An intraday and historical price chart for the figure's largest holdings, using the same internal price-tick store the rest of DipSkip uses.
Before subscribing, scan the recent-filings list. If you see filings flagged as requires review or low confidence, those will not auto-trade — they're held for our team to verify. The figure's snapshot reflects only filings we've fully resolved.
Data Sources
DipSkip pulls clone-related data directly from public US government sources. We do not license filing data from any third-party vendor, and we have no private feed, advance notice, or non-public relationship with any politician, insider, fund, regulator, or filer. Every position we mirror was already public at the time we ingested it.
Sources We Currently Support
| Source | Filer Type | Reporting Lag | Identifier |
|---|---|---|---|
| SEC Form 4 (EDGAR) | Corporate insiders (officers, directors, 10%+ owners) | 2 business days from transaction | CIK |
| SEC Form 13F (EDGAR) | Institutional investment managers | Quarterly + up to 45 days | CIK |
| U.S. House PTR (clerk.house.gov) | Sitting House members | Up to 30–45 days (STOCK Act) | BioGuide ID |
| U.S. Senate PTR (efdsearch.senate.gov) | Sitting Senators | Up to 30–45 days (STOCK Act) | BioGuide ID |
What "Public Source" Means Here
The raw filings are in the public domain. The structured, parsed, classified, and confidence-gated form you see on DipSkip — including our pipeline's outputs — is DipSkip's own work product. We surface the source URL on each filing detail page so you can independently verify the underlying document.
How the Pipeline Works
Every figure binds to one source adapter. Behind the scenes the same general pipeline runs for all of them:
- Fetch. The adapter polls the source on a schedule (Form 4 is checked every 5 minutes; PTR and 13F on slower cadences matched to source update frequency).
- Dedup & persist raw. New filings are deduped by source filing ID and stored verbatim in
clone_raw_filings, so the original payload is always recoverable. - Extract. A source-specific extractor converts the raw payload into a structured filing. Form 4 uses deterministic XML parsing. House and Senate PTRs use PDFBox text extraction plus a Haiku LLM pass.
- Cross-check. This step applies to the LLM-based PTR extractions:
- Form 4 (XML): no LLM cross-check is needed — extraction is deterministic parsing of named XML fields, so values are represented exactly as filed. The deterministic checks below are the validation.
- PTRs (LLM-based): when the primary Haiku pass had to read a scanned or column-shredded PDF image (or produced a low-confidence row), the extractor runs a second pass with a different, more conservative prompt and keeps only transactions that both passes confirm; anything not in the intersection is dropped silently and logged. PTRs that parse cleanly from embedded text are kept on a single pass.
- Deterministic checks. Ticker format, share bounds, date sanity, and disclosure-lag plausibility are checked regardless of source.
- Composite score. Extractor confidence and the deterministic score are combined via
min()per result and logged as a pipeline-health signal. - Persist. Surviving transactions are written to
clone_extracted_filingswithreview_status='auto_approved'. - Mirror. Approved filings are picked up by
CloneManageron its next tick and converted into Tradier orders, scaled by your allocation.
When PTRs Get a Second Pass
Congressional PTRs are published as PDFs — often scanned. When a PTR's embedded text is missing or column-shredded, our extractor reads the PDF image directly, and that is where a single LLM pass is most prone to hallucinate or misclassify. In that case we run a second pass with a stricter, more conservative prompt (omit anything ambiguous), so a hallucinated row from the first pass typically doesn't appear in the second — and the intersection drops it. PTRs that parse cleanly from embedded text are mirrored on a single pass; the deterministic checks and the confidence gate still apply to every transaction either way.
Verification & Cross-Check
Clone Trader's safety net is automated and runs on every ingested filing. How a transaction is verified depends on the source format; low-confidence extractions are held for manual review rather than auto-traded.
LLM-extracted sources: risk-gated second pass
For House and Senate PTRs, where the source document is a (sometimes scanned) PDF and the extractor is a Haiku LLM call, the pipeline runs a second independent pass when the primary extraction is higher-risk — specifically when the embedded text was missing or column-shredded and the model had to read the PDF image directly, or when a row came back low-confidence:
- Pass 1 — Haiku is asked to extract every transaction it can identify, omitting only fields it cannot determine.
- Pass 2 — Haiku is asked to audit the same filing and include only transactions it can confirm with high confidence; anything ambiguous is omitted.
When a second pass runs, the orchestrator takes the intersection of the two results: a transaction is persisted (and ultimately mirrored) only if both passes report it with matching ticker, action, date (±1 day tolerance for date parsing noise), and overlapping disclosed dollar range. PTRs that parse cleanly from embedded text are extracted on a single pass — that is where the model is most reliable, so the second call is reserved for the cases that actually carry misread risk.
Transactions that appear in only one pass are dropped silently and logged for telemetry. The two prompts approach the same document from different angles, so hallucinated rows from one pass typically don't survive the other — but there is no guarantee. Both passes can still agree on the same wrong answer, and a single-pass extraction carries the model's own first-read risk.
Form 4 (XML): deterministic parsing
For SEC Form 4, the extractor is deterministic XML parsing — disclosed values are read directly from named fields and represented as filed, with no LLM in the extraction path. The deterministic checks below are the cross-check for this source.
Deterministic checks (every source)
- Ticker is a valid US equity symbol format.
- Shares (or dollar range) within sane bounds for the figure's known holdings.
- Event date is plausible relative to the filing date and the source's reporting-lag rules.
- Disclosure-lag plausibility (e.g., a House PTR claiming a same-day transaction is suspicious).
What you'll see as a user
When a filing's row gets dropped by consensus, it doesn't appear on your timeline at all — it simply never becomes a trade. The headline number on the figure's detail page (transactions ingested vs. mirrored) reflects only what survived the cross-check. If a source starts producing a high rate of consensus drops, that signal shows up in our internal telemetry and we investigate before it affects user accounts.
Subscribing to a Figure
From a figure's detail page, click Subscribe. The subscribe form asks for:
- Brokerage account — Live Tradier, paper, or both (separate subscriptions).
- Allocation mode — Dollar-anchored (recommended) or percentage-per-trade. See Allocation Modes.
- Allocation value — Either a dollar amount (e.g., $10,000) or a per-filing percentage.
- PTR amount strategy — Only shown for figures whose data source is U.S. House or Senate PTR. See PTR Dollar-Range Strategy.
- Acknowledgments — You confirm you've read the Clone Trader risk disclosure, accept that snapshots may be imperfect, and understand that disclosure lag and cost-basis divergence are inherent to this feature.
Once subscribed, DipSkip will (a) snapshot the figure's current resolved holdings, (b) place initial mirror orders if you chose the dollar-anchored mode, and (c) watch for new filings and auto-trade them as they're approved.
Allocation Modes
Clone Trader supports two allocation modes. They behave differently — pick whichever matches your mental model of "follow this person."
Dollar-Anchored (recommended)
You set a fixed dollar amount, e.g., $10,000. On the first tick after you subscribe,
DipSkip:
- Pulls the figure's current resolved holdings.
- Looks up live market prices for each ticker.
- Computes a scaling ratio that makes the total dollar value of the mirrored portfolio fit inside your $10k.
- Queues initial BUY orders for every ticker in the snapshot.
- Freezes the scaling ratio.
- Advances the figure's last-synced filing date to NOW so historical filings don't double-up.
After the initial snapshot, every new filing from that figure is scaled by the same frozen ratio. This is the mode that most closely matches the copy-trading mental model of "buy what they own, proportionally to my capital."
Per-Trade Percentage
You set a percentage, e.g., 5%. On every filing, DipSkip computes the share count as
5% of the figure's disclosed share count, ignoring portfolio context. There is no initial snapshot.
Use this mode if you want to follow only the figure's marginal trading activity going forward, without front-loading a snapshot of where they currently stand.
PTR Dollar-Range Strategy
Congressional Periodic Transaction Reports (PTRs) disclose only a dollar range, not an exact share count. The actual amount the politician traded is not knowable. The disclosed brackets defined by the STOCK Act look like this:
- $1,001 – $15,000
- $15,001 – $50,000
- $50,001 – $100,000
- $100,001 – $250,000
- $250,001 – $500,000
- $500,001 – $1,000,000
- $1,000,001 – $5,000,000
- $5,000,001 – $25,000,000
- $25,000,001 – $50,000,000
- Over $50,000,000
When you subscribe to a House or Senate figure, DipSkip asks how you want to interpret each range:
- Low — Use the low end of the disclosed bracket. Most conservative.
- Midpoint (default) — Use the midpoint of the disclosed bracket.
- High — Use the high end of the disclosed bracket. Most aggressive.
DipSkip divides the selected dollar value by the live market price at the time of mirroring, then applies your allocation (percent or frozen ratio) on top of that. This setting only applies to PTR figures. Form 4 figures disclose exact share counts and bypass this logic entirely.
You Will Not Know the Actual Amount
The bracket is the disclosure. No matter which option you pick, your share count for a PTR-derived trade is an estimate, not a match. Politicians are not required to disclose exact amounts.
Clone Dashboard
Each active clone subscription shows up on the Clone tab. From there you can see:
- The figure's name, data source, and current allocation.
- Your mirror portfolio — the open positions DipSkip has bought on your behalf.
- The filing timeline — every filing we've ingested for this figure since you subscribed, color-coded by status (auto-approved, requires review, pending).
- An intraday and historical chart driven by our internal price-tick capture, so you can see where mirror orders fired relative to price.
- A data-feed status banner — yellow if the source feed is degraded, green when it's healthy. The banner is driven by our PipelineHealthMonitor.
- Controls to pause auto-trade, close all clone positions, or unsubscribe.
Notifications
Clone Trader hooks into the same notification preferences as the rest of DipSkip. You'll get email and in-app notifications for:
- New filing ingested — A new filing for a figure you follow has been extracted and approved.
- Mirror trade fired — DipSkip placed a real or paper order on your behalf based on a filing.
- Requires review — A filing for your figure landed in the review queue and is awaiting verification.
- Source feed degraded — Our pipeline can't reach the source (e.g., clerk.house.gov is down). Held automatically; you'll be notified again when it recovers.
- Subscription pause / unsubscribe — Confirmation that your clone has been paused or closed.
- Execution skipped — out of credits — A clone execution was skipped because your AI credit balance is empty. Sent up to 5 times per outage; the clone resumes automatically once you have credits again. See Credits & Cost.
Email alerts honor your email_alerts_paper and email_alerts_live settings the same
way script and AI prompt alerts do.
Credits & Cost
Running a clone costs 1 AI credit per execution, drawn from the same monthly credit pool used by AI prompts, AI Chat, DipScript Translation, and the Stock Screener. An execution is a single reconcile tick: the clone compares the figure's current snapshot to your broker positions and places any mirror trades the difference requires.
- Charged once per execution — not per ticker, and not per individual mirror trade. One tick that rebalances ten symbols is still 1 credit.
- Market hours only — executions outside market hours, on a paused/cancelled subscription, or while your Tradier connection is disconnected are not charged.
- You control the cost — your clone's check frequency is up to you. Checking more often mirrors faster but spends more credits; checking less often is cheaper. Because disclosure data is delayed by days to weeks, a slower cadence rarely loses any signal.
Running out of credits
If you have no credits left when an execution is due, that execution is skipped in full — the clone does not check the snapshot, does not place any trades, and fires no trade alerts for that tick. Your existing positions are never touched. The subscription simply idles until credits are available again, at which point it resumes automatically on the next tick (no need to restart it).
Each time an execution is skipped you'll get an email letting you know the clone is idle — capped at 5 notices per outage so a long dry spell doesn't flood your inbox. The counter resets the moment the clone runs again. To avoid the gap entirely, top up in the Credit Store or enable Auto-Refill so your balance is replenished before it hits zero.
Caveats & Limitations
Snapshots Are Not Perfect
Any portfolio snapshot or trade list you see for a clone figure is a best-effort reconstruction. It is not an authoritative record of that figure's actual holdings. Specific failure modes:
- The source may not have published a filing yet, or may have published it late.
- The source may have a typo, wrong ticker, or have used an issuer name that maps ambiguously.
- An amended or retracted filing may supersede a previous one before we catch the amendment.
- The figure may hold assets not covered by the filing regime (e.g., private equity, real estate, options not in 13F long table).
Parsing Errors Happen
Particularly for scanned PTR PDFs, our LLM + verifier pipeline can produce errors despite confidence gating. Tickers can be misread (especially short ones on low-quality scans), transactions can be misclassified, and edge-case filings can fail extraction entirely. Confidence gating is the safety net, not a guarantee.
Disclosure Lag Is Inherent
Politicians have up to 30–45 days under the STOCK Act. Form 13F is quarterly + 45 days. By the time DipSkip mirrors a disclosed trade, the figure's actual position and the broader market may have moved significantly. You are trading at today's price, not theirs.
Cost Basis & Fill Price Will Diverge
- Insider acquisitions are often compensation events (RSUs, option exercises, grants) where the insider's effective cost is well below market. You pay full market.
- You buy days or weeks after the filer, into a different market.
- For PTRs, your share count is derived from a dollar range and the live price, not the politician's exact trade.
- Slippage, commissions, partial fills, and your broker's order routing may further alter your execution.
Not a Recommendation
The availability of a figure on DipSkip is not a recommendation by DipSkip to follow them. We do not endorse any politician, insider, or fund, and we do not represent that any of their past activity is predictive of future results. You decide who to follow, your allocation, and your strategy.
Full Risk Disclosure
For the full legal disclosure, see Clone Trader Risks in the website Risk Disclosure, and Section 8 of the DipSkip Terms of Service.
Script Scheduling
When you run a script, you can configure how frequently it executes. The execution frequency determines how often your script checks conditions and potentially makes trades.
Setting Execution Frequency
When adding a script to the engine from the Repository, you'll see a frequency selector. Common options include:
- Every 5 seconds: Very frequent checking, good for scalping
- Every 15 seconds: Frequent updates while reducing API load
- Every 30 seconds: Balanced frequency for most strategies
- Every 1 minute: Less frequent, suitable for swing-style day trading
- Every 5 minutes: Infrequent checking for longer-term positions
How Scheduling Works
The execution engine runs your script at the configured interval:
- Fetch the current market price for your ticker
- Update all built-in variables ($PROFIT, $MARKET_PRICE, etc.)
- Evaluate each line of your script from top to bottom
- Execute any commands where conditions are met
- Wait for the next scheduled execution
Choosing the Right Frequency
| Strategy Type | Recommended Frequency | Reason |
|---|---|---|
| Scalping | 5-15 seconds | Need to catch small price movements quickly |
| Momentum | 15-30 seconds | Balance between responsiveness and stability |
| Swing (intraday) | 1-5 minutes | Larger moves, less noise from small fluctuations |
API Rate Limits
Very frequent execution (every 5 seconds) uses more API calls. If you're running multiple scripts simultaneously, consider slightly longer intervals to stay within broker API limits.
Circuit Breakers
Circuit breakers are safety mechanisms that automatically pause your script when certain risk thresholds are exceeded. They protect you from runaway losses, malfunctioning strategies, and unusual market conditions.
Why Use Circuit Breakers
Even well-tested strategies can behave unexpectedly in live markets. Circuit breakers provide a safety net by automatically stopping execution when predefined limits are hit. This gives you time to review what happened before losses accumulate.
Types of Circuit Breakers
1. Max Loss Protection
Pauses your script when the current position loses more than a specified amount. You can configure this as a dollar amount or percentage.
- Dollar-based: "Pause if I lose more than $500"
- Percentage-based: "Pause if I lose more than 10%"
When triggered, the script pauses but your position remains open. You must manually decide whether to close the position or resume the script.
2. Consecutive Losses
Pauses your script after a series of losing trades in a row. This catches strategies that may be malfunctioning or trading against a strong trend.
- Tracks sell trades that result in a loss
- Triggers after N consecutive losing trades
- Resets the count after any profitable trade
3. Rapid Trade Limiting
Pauses your script if it executes too many trades in a short period. This protects against scripts that might be rapidly cycling in and out of positions due to a logic error.
- Monitors trades per minute
- Triggers when trade frequency exceeds the limit
- Prevents excessive commission costs
Configuring Circuit Breakers
Circuit breakers are configured when you add a script to the engine:
- Go to the Repository tab
- Click Run on the script you want to start
- In the dialog, expand the Circuit Breakers section
- Enable and configure each circuit breaker type
- Click Start Script
When Circuit Breakers Trigger
When any circuit breaker is triggered:
- The script immediately pauses
- You receive an email notification (if enabled)
- The dashboard shows the paused status with the reason
- Your existing position remains unchanged
Resetting Circuit Breakers
When you resume a paused script, all circuit breaker counters are reset to zero. This means:
- The consecutive loss counter goes back to 0
- The rapid trade counter resets
- Max loss tracking starts fresh from your current position
This gives you a clean slate after reviewing what triggered the circuit breaker and deciding to continue running your strategy.
Recommended Settings
Start with conservative circuit breaker settings and adjust based on your strategy's normal behavior. A max loss of 5-10% and 3 consecutive losses is a reasonable starting point for most strategies.
Circuit Breakers Don't Sell
Circuit breakers pause your script but do not automatically sell your position. If you
want automatic selling at a loss threshold, use a stop-loss condition in your script
(e.g., IF $PROFIT < -500 THEN SELL $ALL). Circuit breakers are an additional
safety layer on top of your script logic.
Email Notifications
DipSkip sends email notifications to keep you informed about important events. Notifications are sent to the email address associated with your account.
Types of Notifications
Script Error Notifications
Sent when a script encounters an error and pauses. The email includes:
- Script name and ticker symbol
- Error description
- Correlation ID for debugging
- Whether it's a paper or live trading script
Circuit Breaker Notifications
Sent when a circuit breaker triggers. The email includes:
- Which circuit breaker was triggered
- The threshold that was exceeded
- Current position status
- Script details
Alert Notifications
Sent when alerts you've configured are triggered (see Alerts). These include price alerts, profit/loss alerts, and trade alerts.
Notification Settings
You can configure notification preferences in the Settings tab. Options include enabling or disabling specific notification types.
Check Your Spam Folder
If you're not receiving notifications, check your spam or junk folder. Add the DipSkip sender address to your contacts to ensure delivery.
Repository
The Repository is where all your saved scripts (flows) are stored. Think of it as your strategy library—scripts you've created but aren't currently running.
Repository vs Engine
- Repository: Storage for saved scripts (not running)
- Engine: Scripts that are actively running and trading
You create and edit scripts in the Editor, save them to the Repository, and then add them to the Engine when you want them to start trading.
Managing Your Repository
The Repository tab shows all your saved flows with:
- Script name and ticker symbol
- Paper or live trading designation
- Last modified date
- Action buttons (Run, Edit, Duplicate, Delete)
Running a Script
To start a script from the Repository:
- Find the script in your Repository
- Click the Run button
- Configure execution frequency and circuit breakers
- Click Start Script
The script moves to the Engine and begins executing at your configured frequency.
Flow Actions
The Repository provides several actions for managing your scripts.
Duplicate Flow
Creates an exact copy of a script. Useful when you want to:
- Test variations of a strategy without modifying the original
- Create a paper trading version of a live script
- Use an existing script as a template for a new one
The duplicate is saved with "(Copy)" appended to the name. You can rename it after duplication.
Transfer Flow
Moves a script between paper trading and live trading modes. When you transfer:
- The script code remains identical
- Variables are reset (profit history, trade counts, etc.)
- The script must be re-added to the Engine to run
Transfer Carefully
Transferring from paper to live means real money is at stake. Always verify your script logic is working correctly in paper trading before transferring to live.
Delete Flow
Permanently removes a script from your Repository. This action cannot be undone. If the script is currently running in the Engine, you must stop it first.
Auto-Sell on Delete
When you delete or stop a running script, DipSkip can optionally sell any shares that script was managing. This is controlled by the Auto-sell script stock setting in your Settings.
- Enabled: Automatically sells shares when script is stopped/deleted
- Disabled: Leaves shares in your account (you must sell manually)
Reload from Repository
If you've edited a script in the Editor and saved it to the Repository while a copy is still running in the Engine, you can reload it without stopping the script. This lets you update your strategy on the fly—adjusting thresholds, adding conditions, or tweaking logic—while the script continues running.
How to Reload
On the Dashboard, find the running script you want to update and click the Reload button next to it. A diff view will appear showing exactly what changed between the running version and the saved version.
- Edit your script in the Editor and save it to the Repository
- Go to the Dashboard and find the running script
- Click the Reload button (the orange sync icon)
- Review the diff—lines removed are shown in red, lines added in green
- Click Apply Changes to update the running script
Ticker Restriction
When reloading from the Repository, the saved script must use the same ticker as the running script. If you've changed the ticker in the saved version, the reload will be blocked and you'll see a message explaining why.
Why can't I change tickers?
A running script accumulates state tied to its ticker—profit tracking, trend calculations, peak price, and other variables are all based on the current stock. Swapping the ticker mid-run would cause all of those variables to reference the wrong stock, potentially triggering incorrect buy or sell decisions with real money. To trade a different ticker, stop the running script and start a new one from the Repository.
What Gets Updated
- The script code (conditions, commands, thresholds) is replaced with the saved version
- Accumulated variables ($PROFIT, $PEAK_PROFIT, etc.) are preserved—they are not reset
- The script continues executing at its current frequency without interruption
Orders Tab
The Orders tab provides a comprehensive view of all trades executed by your scripts. Review your trade history, analyze performance, and manage pending orders.
Order History
The main orders table shows every executed trade with:
- Date/Time: When the order was filled
- Script: Which script placed the order
- Symbol: Stock ticker
- Side: Buy or Sell
- Quantity: Number of shares
- Price: Average fill price
- Profit: For sell orders, the realized profit/loss
Filtering Orders
Use the filter controls to narrow down the order list:
- Date Range: View orders from a specific period
- Symbol: Filter to a specific stock
- Side: Show only buys or only sells
- Script: Filter to a specific script's orders
Order Statistics
The top of the Orders tab displays summary statistics:
- Total number of trades
- Total realized profit/loss
- Win rate (percentage of profitable sells)
- Average profit per trade
Manual Order Actions
Manual Sell
From the Dashboard, you can manually sell shares that a script is managing. Click the Sell button next to a running script to immediately liquidate the position at market price.
Cancel Pending Orders
If a limit order hasn't filled yet, you can cancel it. Pending orders appear in the Orders tab with a "Pending" status and a Cancel button.
Manual Actions and Scripts
If you manually sell shares while a script is running, the script will detect the new position size on its next execution. Be aware that the script may immediately buy back shares if your entry conditions are still met.
Performance Tab
The Performance tab provides detailed analytics about your trading results over time. Track profitability, identify patterns, and measure the effectiveness of your strategies.
Performance Overview
The main dashboard shows key metrics:
- Total Profit/Loss: Cumulative realized P&L across all scripts
- Today's P&L: Profit or loss from today's trades
- Win Rate: Percentage of trades that were profitable
- Total Trades: Number of completed round-trip trades
Performance by Symbol
See how each stock you've traded has performed:
- Profit/loss per symbol
- Number of trades per symbol
- Win rate per symbol
- Average profit per trade
This helps identify which stocks your strategies work best on.
Performance History
View your trading results over different time periods:
- Daily breakdown
- Weekly summary
- Monthly totals
Cumulative Performance Chart
A chart showing your cumulative profit/loss over time. This visualizes:
- Overall growth or decline
- Consistency of returns
- Drawdown periods
- Recovery patterns
Use Performance Data to Improve
Regularly review your performance metrics. If certain symbols consistently underperform, consider removing them from your strategies. If specific time periods show losses, analyze what market conditions were present.
Settings Overview
The Settings tab contains all configuration options for your DipSkip account. Access it from the main navigation to customize trading behavior, notifications, and display preferences.
Settings Categories
- Trading Settings: Control trading behavior and safety features
- Notification Settings: Configure email alerts and notifications
- Display Settings: Timezone and formatting preferences
- Account Settings: Broker connection and profile information
Trading Settings
These settings control how DipSkip executes trades and manages positions.
Auto-Sell Script Stock
When enabled, DipSkip automatically sells any shares held by a script when you stop or delete that script.
- Enabled: Shares are sold at market price when script stops
- Disabled: Shares remain in your account; you must sell manually
Margin Settings
If you have a margin account, these settings control margin usage:
- Allow Margin: Enable or disable trading on margin
- Max Margin Amount: Limit how much margin can be used
- Margin Warning Threshold: Alert when approaching margin limits
Margin Risk
Trading on margin amplifies both gains and losses. If you enable margin, ensure you understand the risks and have appropriate stop-losses in your scripts.
Notification Settings
Configure which email notifications you want to receive.
Available Notification Types
| Notification | Description | Default |
|---|---|---|
| Script Errors | When a script pauses due to an error | Enabled |
| Circuit Breaker Alerts | When a circuit breaker triggers | Enabled |
| Trade Alerts | When configured trade alerts trigger | Enabled |
| Price Alerts | When symbol price alerts trigger | Enabled |
Timezone Setting
Set your preferred timezone for displaying timestamps throughout DipSkip:
- Order timestamps
- Log entries
- Chart data
- Alert triggers
All times are stored in UTC internally and converted to your selected timezone for display.
Market Hours
Regardless of your timezone setting, the US stock market operates on Eastern Time. Regular trading hours are 9:30 AM - 4:00 PM ET.
Account Deletion
You can permanently delete your DipSkip account and all associated data at any time.
How to Delete Your Account
- Navigate to the User tab in the sidebar
- Click Manage Account
- Click "Delete my account and all account data"
- Review the warning that explains exactly what will be deleted
- If you wish to proceed, type the confirmation phrase and click Delete Account
What Gets Deleted
Account deletion is permanent and cannot be undone. The following data is immediately and irreversibly removed:
- Your user account and login credentials
- All saved DipScript strategies and scripts
- Order history and trade records
- Performance data, backtests, and execution logs
- Account settings, alerts, and preferences
- Your Tradier brokerage connection (your Tradier account itself is not affected)
Subscription Cancellation
If you have an active subscription, it will be canceled immediately when you delete your account. No refunds are issued for unused subscription time, including annual plans. By confirming account deletion, you agree to forfeit any remaining subscription time.
Tradier Account
Deleting your DipSkip account only removes your DipSkip data and disconnects the integration. Your Tradier brokerage account remains active and unaffected. You can continue using Tradier independently or reconnect with a new DipSkip account in the future.
Subscription Plans
DipSkip offers three subscription plans billed monthly or annually. Every plan includes every feature — scripts, AI prompts, Skipper, Clone Trader, and all four AI models. The differences are how fast your strategies check the market, how many you can run at once, and how many AI credits are included each month.
| Feature | Basic | Professional | Premium |
|---|---|---|---|
| Monthly price | $39 | $69 | $99 |
| Annual price (savings) | $399 (16% off) | $700 (18% off) | $950 (20% off) |
| Check frequency (reaction speed) | 5 minutes | 30 seconds | 5 seconds |
| Active strategies (scripts & prompts) | 3 | 10 | 25 |
| AI credits per month | 200 | 600 | 2,000 |
| AI chat & DipScript translation | Yes | Yes | Yes |
| AI-powered trading, Skipper & Clone Trader | Yes | Yes | Yes |
| Backtester | 10/month, daily only | Unlimited | Unlimited |
Annual plans are billed once per year at the discounted rate. Monthly plans are billed every month on the day you subscribed. All plans include paper trading, real-time market data, email support, and the full DipScript language.
Upgrading & Downgrading
You can switch between plans at any time. DipSkip uses prorated billing so you only pay for what you use — no double-charging, no lost credit for unused time.
How Proration Works
When you change plans mid-billing-cycle, DipSkip calculates what you've already paid for your current plan and credits the unused portion toward your new plan. The math is straightforward:
- We calculate how much of your current billing period remains (as a percentage)
- We credit that percentage of your current plan's cost back to you
- We charge you the full amount of the new plan
- You only pay the difference:
(new plan cost) − (credit from current plan)
You're 10 days into your Basic $39/month subscription.
20 days remain in the billing period (67% remaining).

Credit for unused Basic time:  $39 × 0.67 = $26.13
New Professional plan cost:    $69.00
Immediate charge:              $69.00 − $26.13 = $42.87

You pay $42.87 today and get Professional features immediately.
Your next billing date stays the same ($69 on the original renewal day).
Upgrading
Upgrades take effect immediately. You get access to the higher plan's features right away (more scripts, faster execution, more AI credits, AI-powered trading if moving to Professional or Premium). You're charged the prorated difference at upgrade time.
Downgrading
Downgrades also take effect immediately, and you receive a prorated credit for the unused portion of your higher plan. This credit is applied to your next invoice, reducing the amount charged on your next billing date.
Downgrade Impact
If you downgrade and have more active scripts than the new plan allows, the oldest scripts beyond the new limit will need to be paused or removed before new scripts can be started. Existing AI credits from your old plan's allotment remain usable until consumed, but future monthly allotments will match the new plan.
Switching Between Monthly and Annual
You can switch from monthly to annual billing (or vice versa) using the same prorated billing logic. Switching to annual typically saves money over the year and is applied as a credit toward the new annual subscription.
AI Credits Across Plan Changes
AI credits are handled separately from subscription billing:
- Monthly plan credits refresh on each billing cycle based on your current plan
- Purchased credits (bought through the AI Credits store) never expire and are kept when you change plans
- Credits already consumed this month are not refunded when you upgrade or downgrade
Cancellation & Refunds
You can cancel your subscription at any time from the Subscription section of your account settings. Cancellation takes effect at the end of your current billing period — you keep full access to all paid features until then.
What Happens When You Cancel
- You retain full access to your current plan until the end of the billing period you've already paid for
- No further charges are made after cancellation
- Your account automatically downgrades to a free state at the end of the period
- Your scripts, prompts, variables, and trade history are preserved — you can resubscribe at any time
- Running scripts will be paused when your subscription lapses
Refund Policy
DipSkip does not issue refunds for unused subscription time. If you cancel mid-period, you keep access through the end of that period but are not refunded for the remaining days. Annual plans are non-refundable after the first 7 days.
If you believe you were charged in error or experienced a technical issue that prevented you from using the service, contact [email protected] and we'll review your case.
Reactivating a Cancelled Subscription
If you cancel and later want to resume, you can simply re-subscribe from the Subscription page. All your saved scripts, prompts, and settings will still be there.
Disclaimer
The examples and strategies shown in this documentation are for educational purposes only and do not constitute financial advice. Trading stocks involves substantial risk of loss and is not suitable for every investor. Always conduct thorough testing, understand the risks, and consider your risk tolerance before implementing any automated trading strategy. Past performance does not guarantee future results.
Comments
Comments let you add notes and explanations to your scripts. They're completely ignored during execution—the script processor removes them before running your code. Use comments to document your strategy, explain complex logic, or leave reminders for yourself.
Comment Syntax
DipScript supports two types of comments: full-line comments and inline comments. Both use the
//syntax, and everything after the slashes is ignored.Full-Line Comments
Start a line with
//to make the entire line a comment:Inline Comments
You can also add comments at the end of any line of code. The code before
//runs normally, and everything after is ignored:Best Practices
Comments Don't Affect Performance
Since comments are stripped before execution, you can add as many as you like without impacting how fast your script runs. Well-commented scripts are easier to debug and modify later.