Meet Skipper: An AI Captain for Your Whole Account
DipScript lets you automate a single idea on a single stock. Skipper is something different: a portfolio manager you write in plain English, handed the helm of your entire account. You describe your strategy once—what to trade, when to enter, how to manage risk—and Skipper makes buy, sell, and hold decisions across every position on your schedule, with live market context the way a real desk would read it.
It is the most hands-off tool we have ever built, and also the most carefully fenced. This post walks through what Skipper is, how it thinks, and the guardrails that keep it honest.
One Strategy, Your Whole Account
A DipScript script trades one ticker. A prompt automates one idea. Skipper zooms out: it reads your full portfolio—every holding, your cash, your buying power—and decides what the account as a whole should do next. Instead of a rule like "buy AAPL on a 3% dip," you write the kind of thing you would tell a portfolio manager:
Example strategy: "Hold the two strongest sectors. Buy relative-strength leaders on pullbacks when the market is risk-on and breadth is healthy. Trim half at +20%, exit fully below the 50-day average, and never put more than 15% in one name. Keep 25% cash when the VIX is elevated."
That single document drives every decision. You are not writing code—you are writing intent, and letting Skipper translate it into trades.
What Skipper Sees on Every Run
A strategy is only as good as the information behind it. On every run, Skipper pairs your written strategy with a live snapshot of both your account and the market—none of it cached, all of it fresh:
Your portfolio, live
- Every position: shares, cost basis, market value, and P&L
- Cash and buying power—what is actually available to deploy
- Total account value
The market, the way a desk reads it
- Regime: the major indices today, SPY versus its 200-day trend, the VIX and its band, distribution-day count, and an overall risk-on / risk-off read
- Breadth: advancers versus decliners, the percentage of the market above its 50- and 200-day averages, new highs and lows, and up/down volume
- Sector rotation: all eleven sectors ranked by relative strength versus the S&P, with 1-, 3-, 6-, and 12-month returns
- Leaders & movers: trend-template leaders by relative-strength rating, the day's top gainers and losers, plus per-stock RS rating, trend score, typical daily range, and sector rank
Its own recent activity
Skipper also sees its last several runs—the trades it already made—so it does not churn, flip-flop, or re-buy something it just sold.
Choose Your Model
Skipper runs on the Claude model you choose, from fast and economical to deep and deliberate. Heavier models reason more thoroughly about your strategy and the market context, at a higher per-run credit cost. Because Skipper only acts during market hours, the run modal shows you a live estimate of credits per day and per month before you ever start it—no surprises.
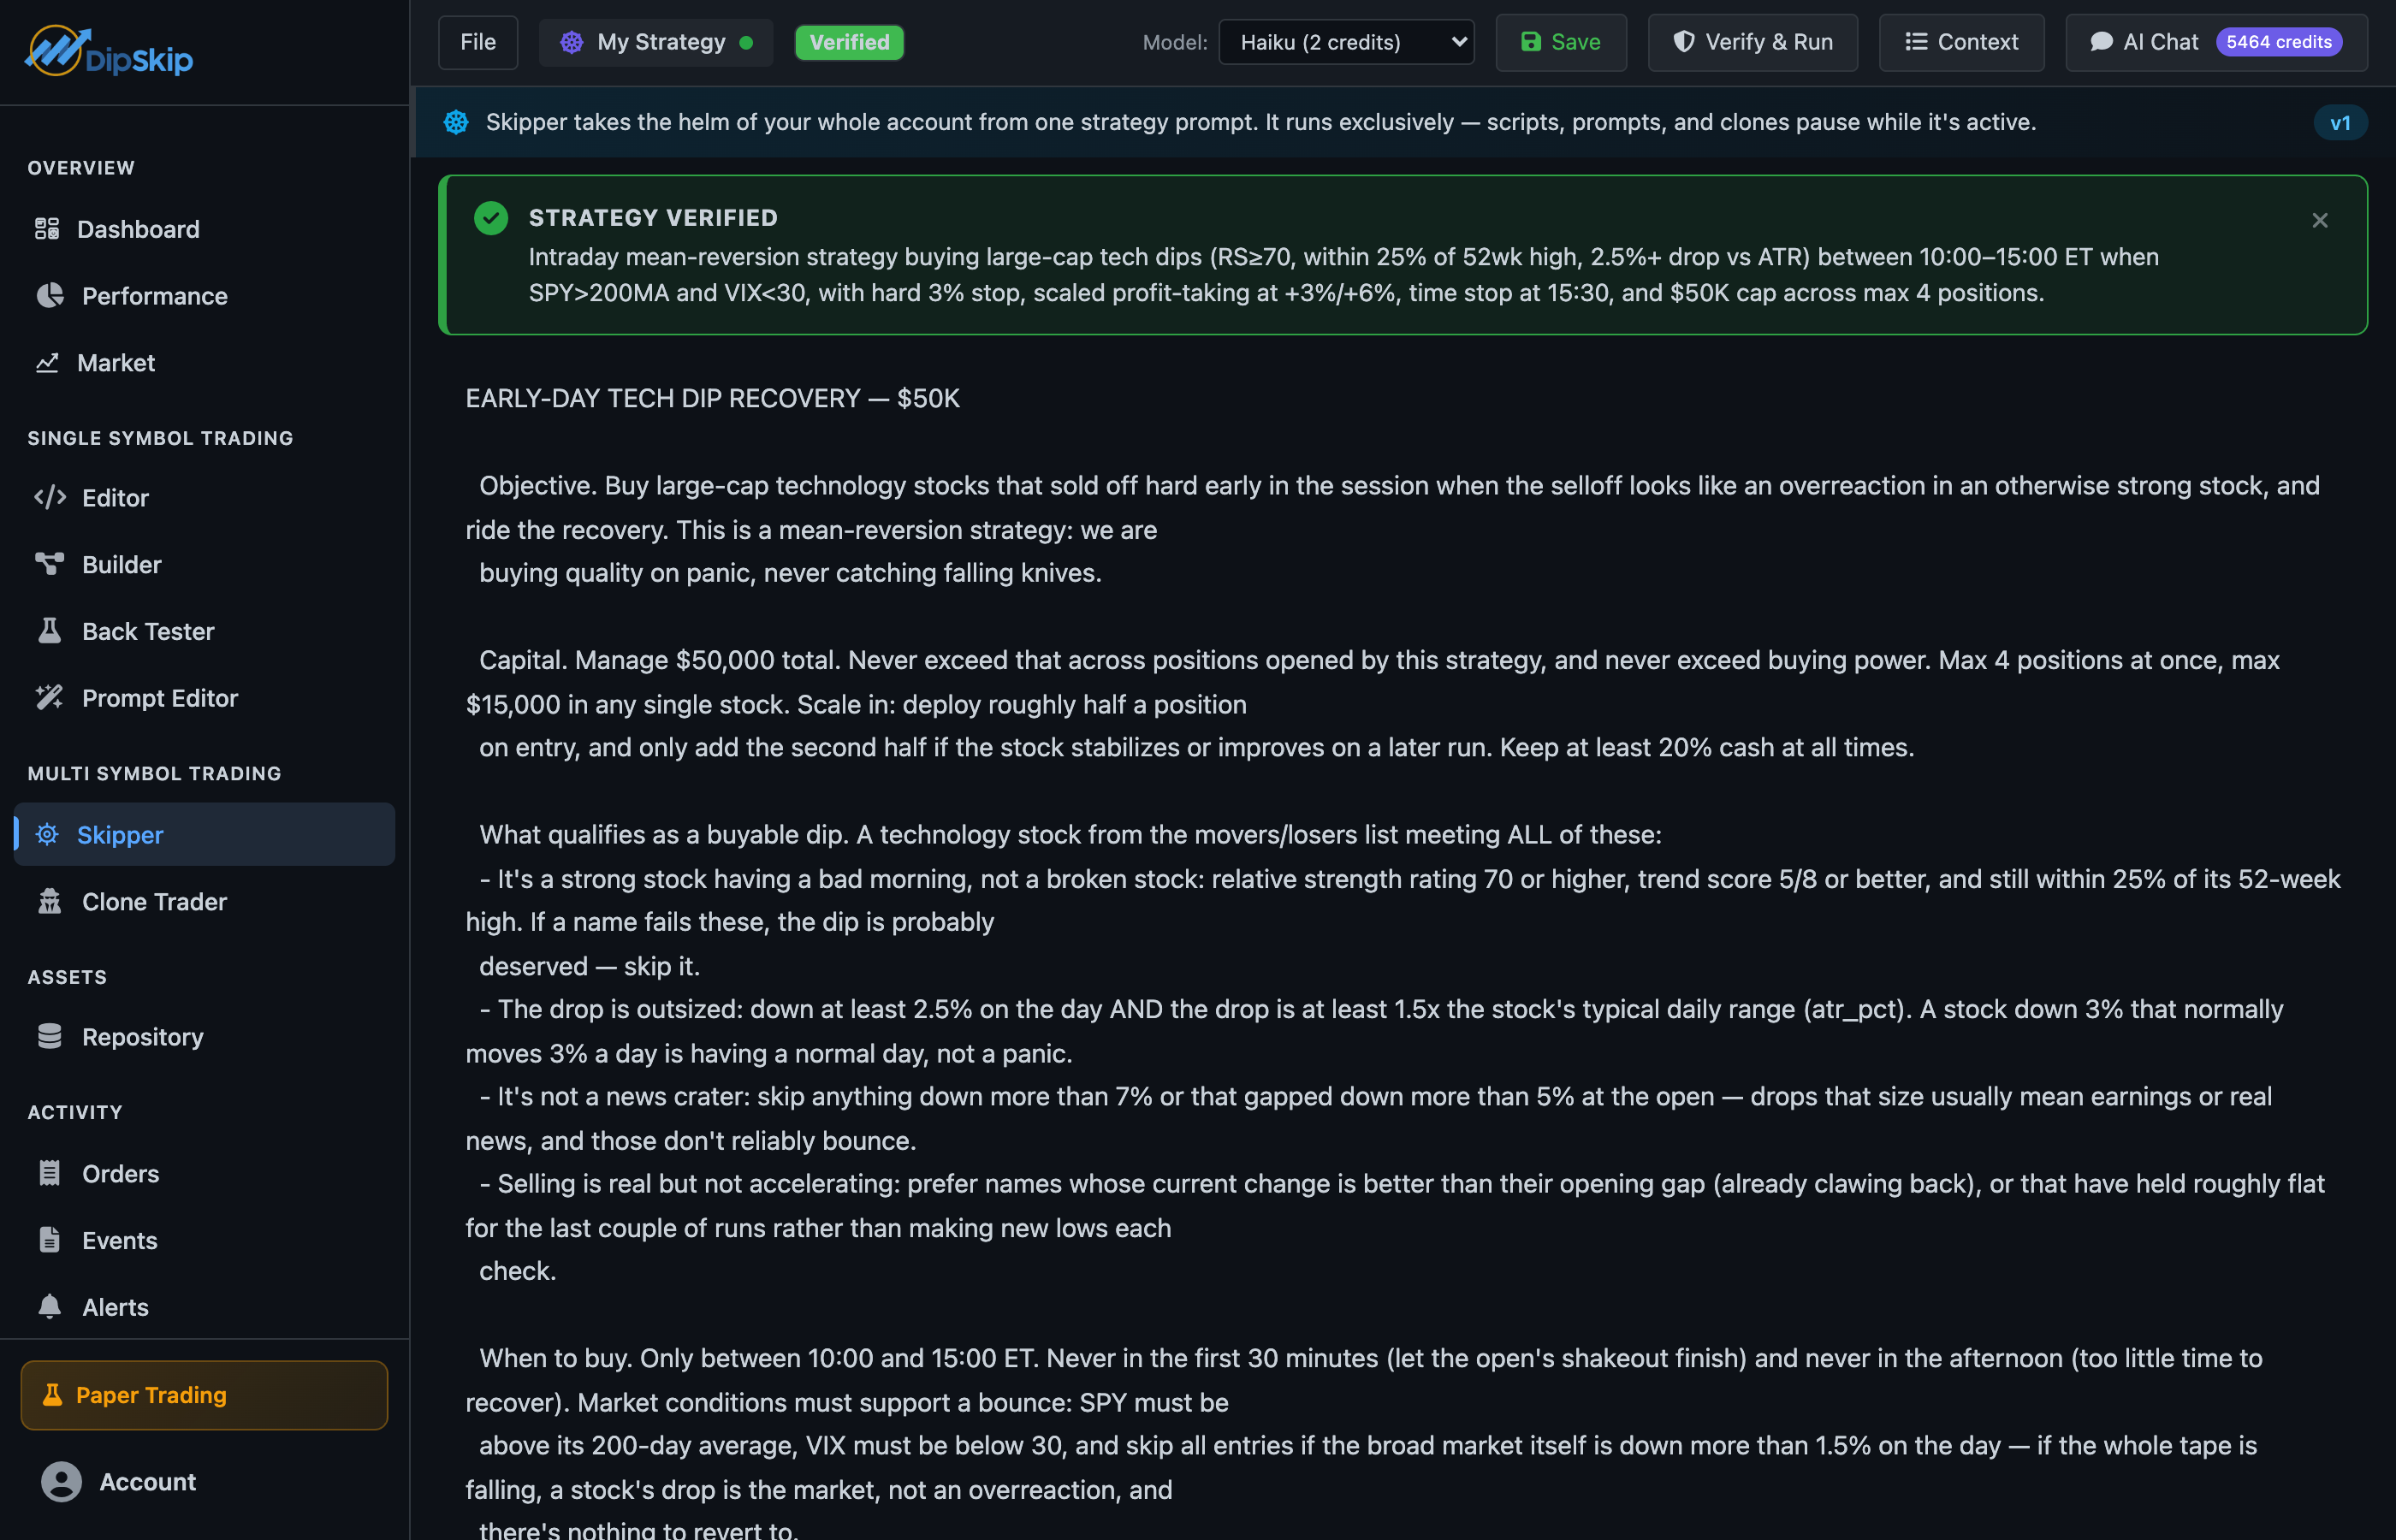
Verification: Fail-Closed by Design
Vague instructions are dangerous when real money is on the line, so Skipper will not run a strategy it cannot understand. Before it can take the helm—and again whenever you edit a running strategy—your document is verified for specificity: does it actually say what to trade, when to enter, and how to exit and manage risk? If it does not, Skipper holds and tells you exactly what is missing. It never trades on a guess.
Every Decision, Validated Twice
The AI proposes; the engine disposes. Every order Skipper wants to place is re-checked server-side before it ever reaches your broker—ticker format, a sane order size, available buying power with a safety buffer, and a live price. Sells are executed before buys so freed-up cash is available to redeploy in the same cycle. The model is the strategist; the engine is the risk officer that has the final say.
Exclusive Control—On Purpose
While Skipper is running, it has the account to itself: your scripts, prompts, and clones are paused from trading. This is deliberate. One strategy at a time per account keeps your positions coherent and prevents two automations from fighting over the same shares. Stop Skipper at any time and strategy mode resumes immediately.
Watch It Work
Once Skipper is at the helm, it appears as a live card on your dashboard—a chart of any position you select, your performance at a glance, and tabs for current positions, recent orders, and a full run history. Each run also records Skipper's own short read of the account, so you can see not just what it did but the thinking behind it.
Edit live, no restart
Refining your strategy does not mean stopping and starting over. Save an edit while Skipper is running and it applies on the very next run—automatically re-verified first. Your strategy evolves with you, without ever taking the account offline.
A Word on Responsibility
Skipper is a powerful tool, not a crystal ball. It executes your strategy with discipline and live data—it does not predict the market, and it cannot provide financial advice. The AI assistant built into the editor can help you sharpen your strategy's wording and logic, but the decisions, and the account, are yours. We recommend starting in paper trading to watch how your strategy behaves before you give it real money.
Pro Tip: Be specific about risk, not just entries. The strategies that behave best are the ones that clearly state position sizing, profit-taking, and exit rules—because that is exactly what keeps Skipper measured when the market gets noisy.
Getting Started
- Open the Skipper tab (it is one of the multi-stock auto-traders).
- Describe your complete strategy—what to trade, when to enter, how to exit and size positions.
- Pick a model and Save. Skipper verifies your strategy.
- Click Verify & Run, choose your check frequency, and review the credit estimate.
- Watch it work from your dashboard—and start in paper trading first.
Skipper turns a paragraph of plain-English intent into a disciplined, whole-account strategy that never sleeps. Write it once, verify it, and let it sail.